Loading...
Apono outbound webhooks integrations with communications and notifications tools
Loading...
Loading...
Loading...
Apono outbound webhooks integrations with IT Service Management tools
Loading...
Loading...
Loading...
Loading...
Loading...
Loading...
Apono outbound webhooks integrations with Logs and Security information and event management tools
Loading...
Loading...
Loading...
Loading...
Loading...
Loading...
Loading...
Loading...
Loading...
Loading...
Loading...
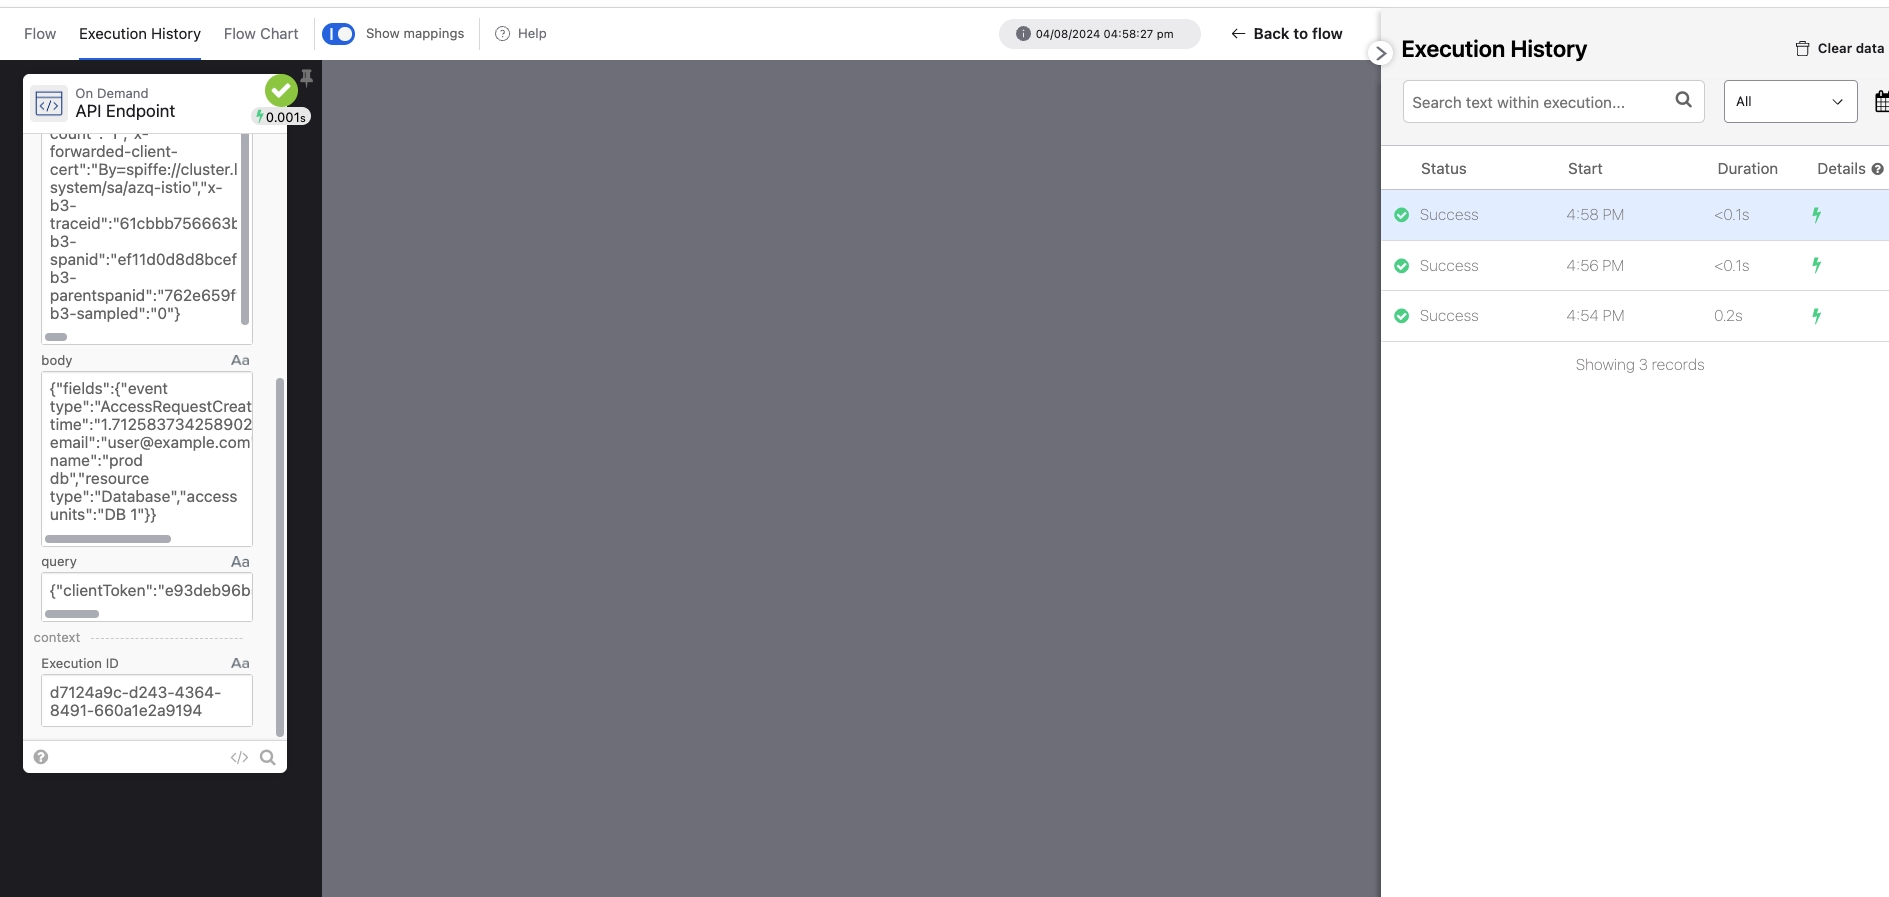
Apono outbound webhooks integrations with orchestration and workflow automation tools
Loading...
Loading...
Send Apono access request data to your internal systems with event-triggered HTTP messages
If you cannot find a guide for your specific tool, you can create a custom Apono outbound webhook.
This guide shows you how to create and test a custom webhook.
Target System API Credentials
Authentication information used when making requests to the target system
Apono supports the following authentication:
Bearer Token
OAuth
Custom (key-value pairs passed in the header)
Target System Webhook URL
URL of the target system that will receive the webhook
Example: https://<SUBDOMAIN>.freshdesk.com/api/v2/tickets
Follow these steps to configure a webhook:
On the Webhooks page, click Add Webhook. The Add Webhook page appears.
Click Request Webhook.
Enter a unique, alphanumeric, user-friendly Request Webhook Name for identifying this webhook.
Click the Status toggle to Active.
From the Method dropdown menu, select a REST method.
In the URL field, enter the URL of the target system that will receive the webhook.
The webhook URL must adhere to the following requirements:
Uses the HTTPS protocol
Does not specify any custom ports
In the Body Template field, construct a JSON body for the webhook payload.
Click View event's payload schema to reveal the payload schema and available data fields. You can also refer to the Webhook Payload Schema Reference to read the descriptions of each data field.
Enter the authentication information required by the target system.
Follow this step to add Bearer Token authentication:
Under Headers, use the Key and Value fields to set the access token.
Authorization
Bearer <API_TOKEN>
Follow these steps to add OAuth authentication:
From the Authentication Type dropdown menu, select OAuth. The OAuth settings appear.
Define the OAuth settings.
Client ID
Unique identifier assigned by the authorization server
Client Secret
Secret key issued by the authorization server
Token Endpoint URL
URL where the authorization code or refresh token is exchanged for an access token
Scopes
(Optional) Set of permissions requested to access specific resources or APIs
Follow these steps to add custom authentication:
Under Headers, use the Key and Value fields to set the credential information.
If your tool or service has several values, enter each key-value pair in a separate row.
The following example uses Datadog as an example.
DD-API-KEY
<API KEY>
DD-APPLICATION-KEY
<KEY ID>
From the Triggers dropdown menu, select one or more of the following event triggers, which correspond to Apono access request statuses:
RequestCreated
RequestApproved
RequestExpired
RequestFailed
RequestGranted
RequestRejected
Under Filters, define one or several filters from the listed dropdown menus.
Filters empower admins to control the data transmitted via webhooks, minimizing the amount of data third-party tools receive and reducing unnecessary clutter.
Examples:
Send only production requests to your admins' Slack channel.
Trigger Okta workflows for events from specific integrations or resource types.
Open a ticket in Jira or ServiceNow for manually approved requests.
(Optional) In the Timeout in seconds field, enter the duration in seconds to wait before marking the request as failed.
(Optional) Define Response Validators to verify that the response from the webhook meets specified criteria:
Click + Add. A row of settings appears.
Starting with $.data., enter the Json Path of the JSON parameter.
In the Expected Values field, enter a value and press the Enter key on your keyboard.
Repeat step c to add several expected values.
Repeat steps a-d to add multiple response validators.
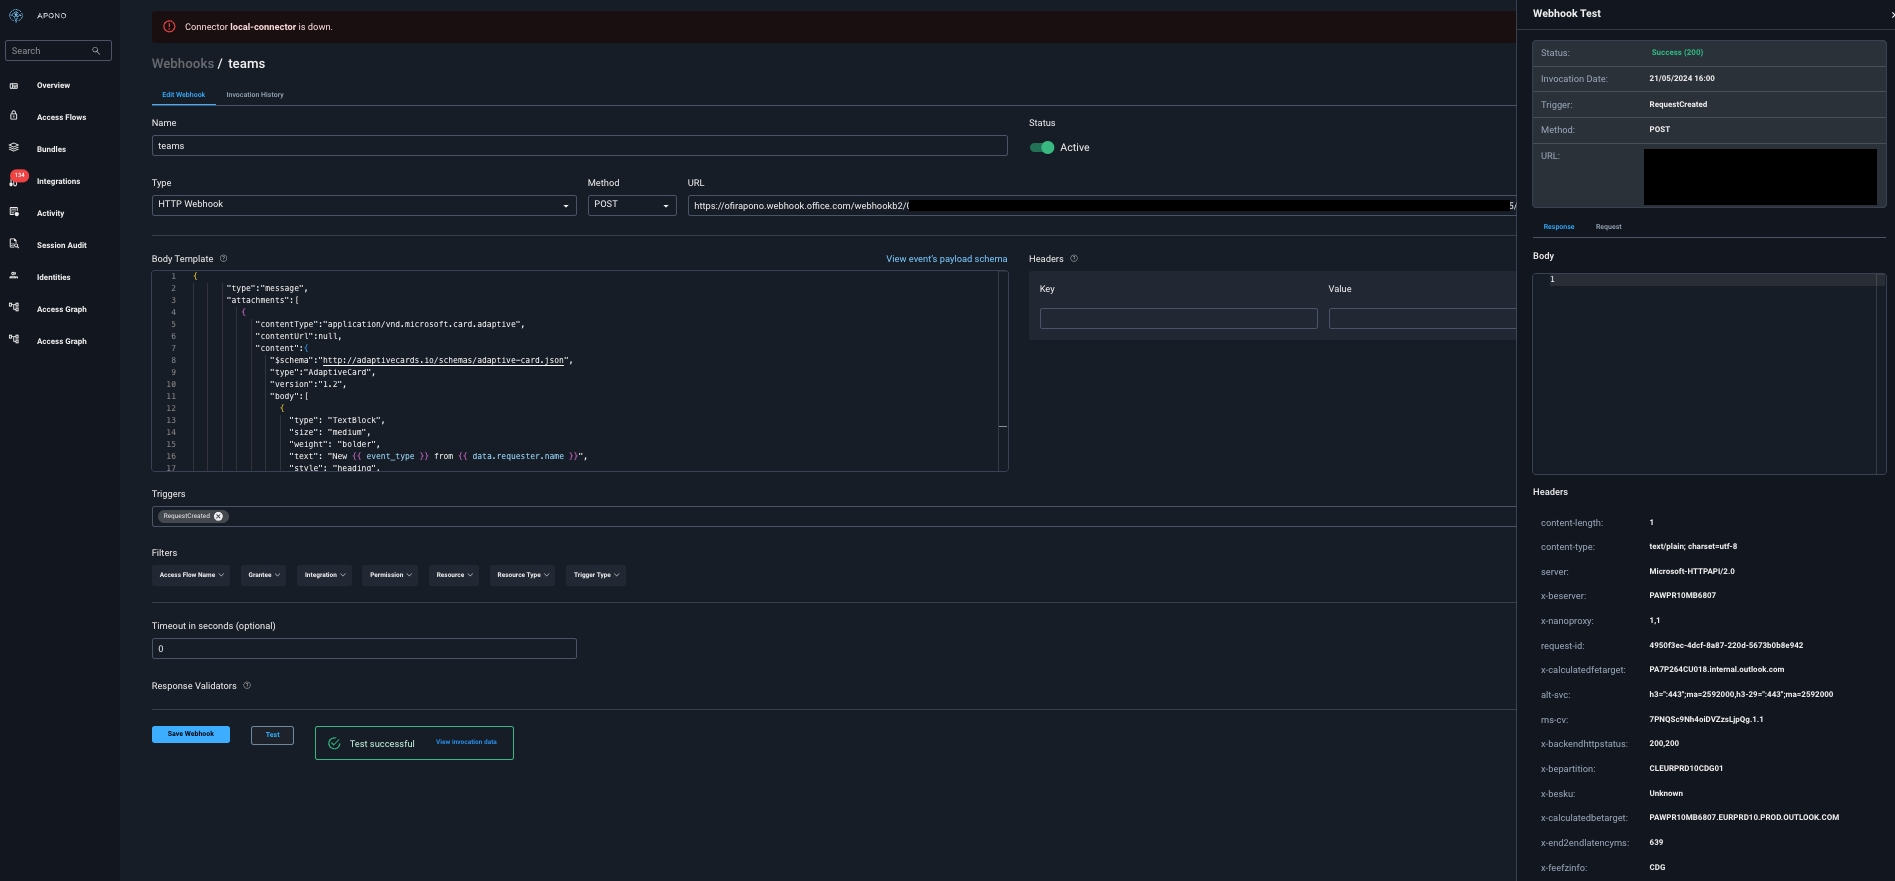
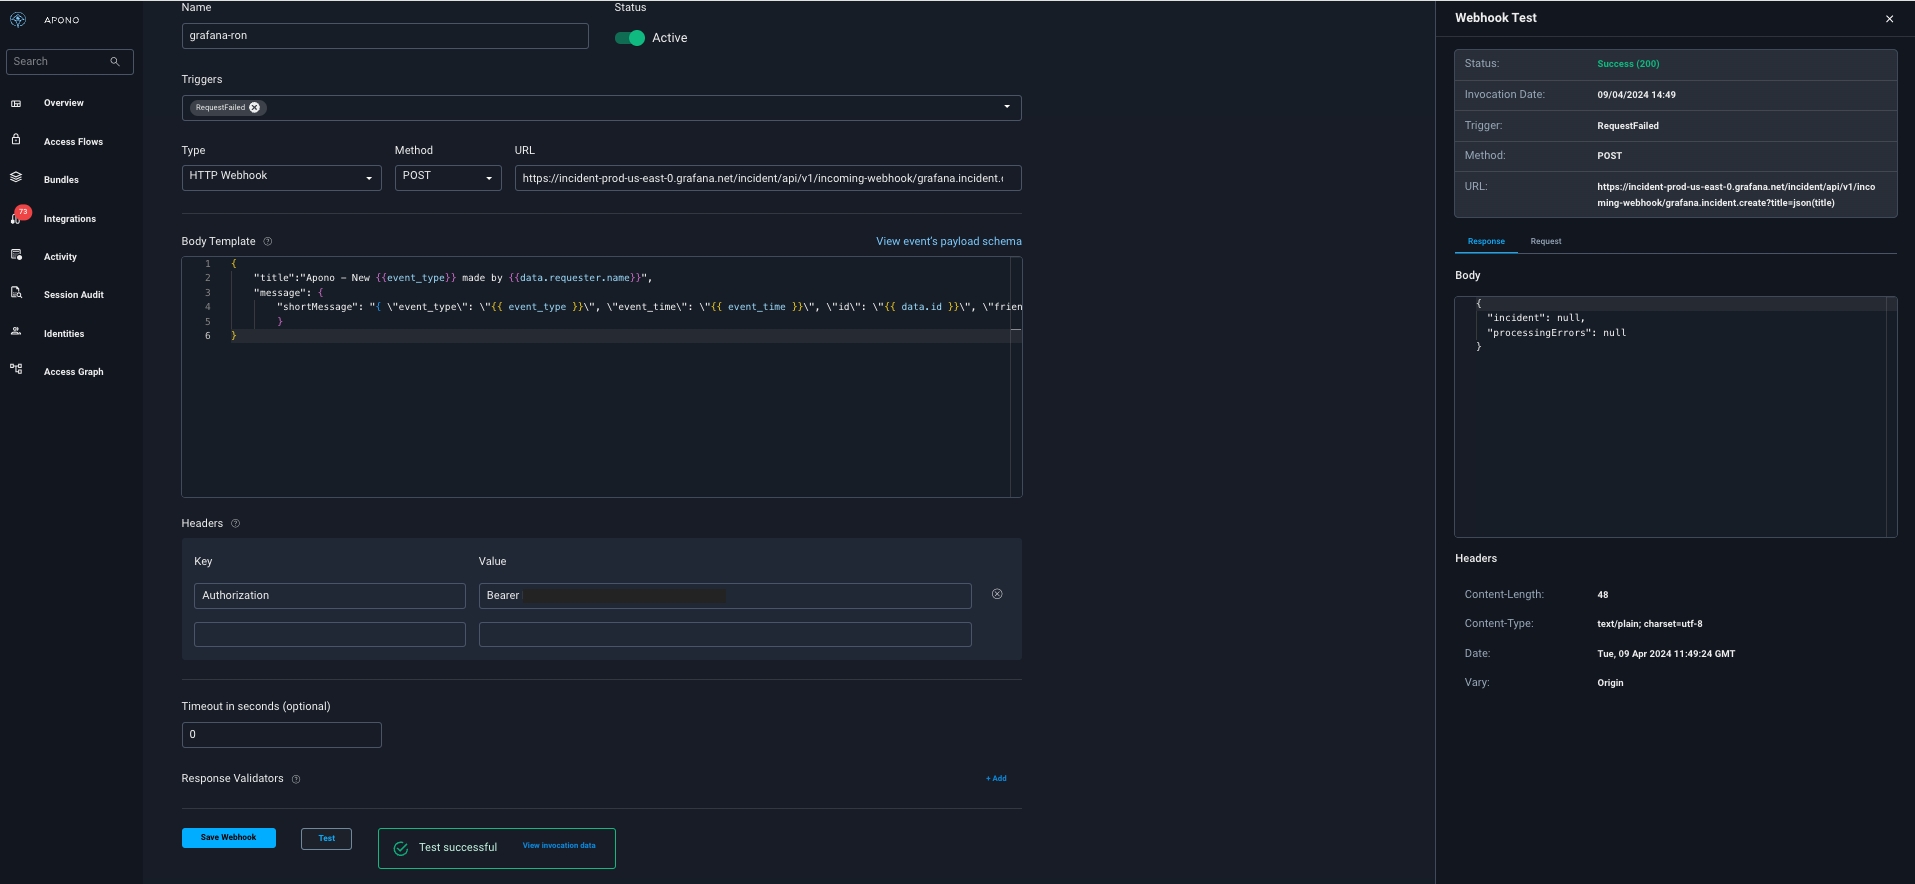
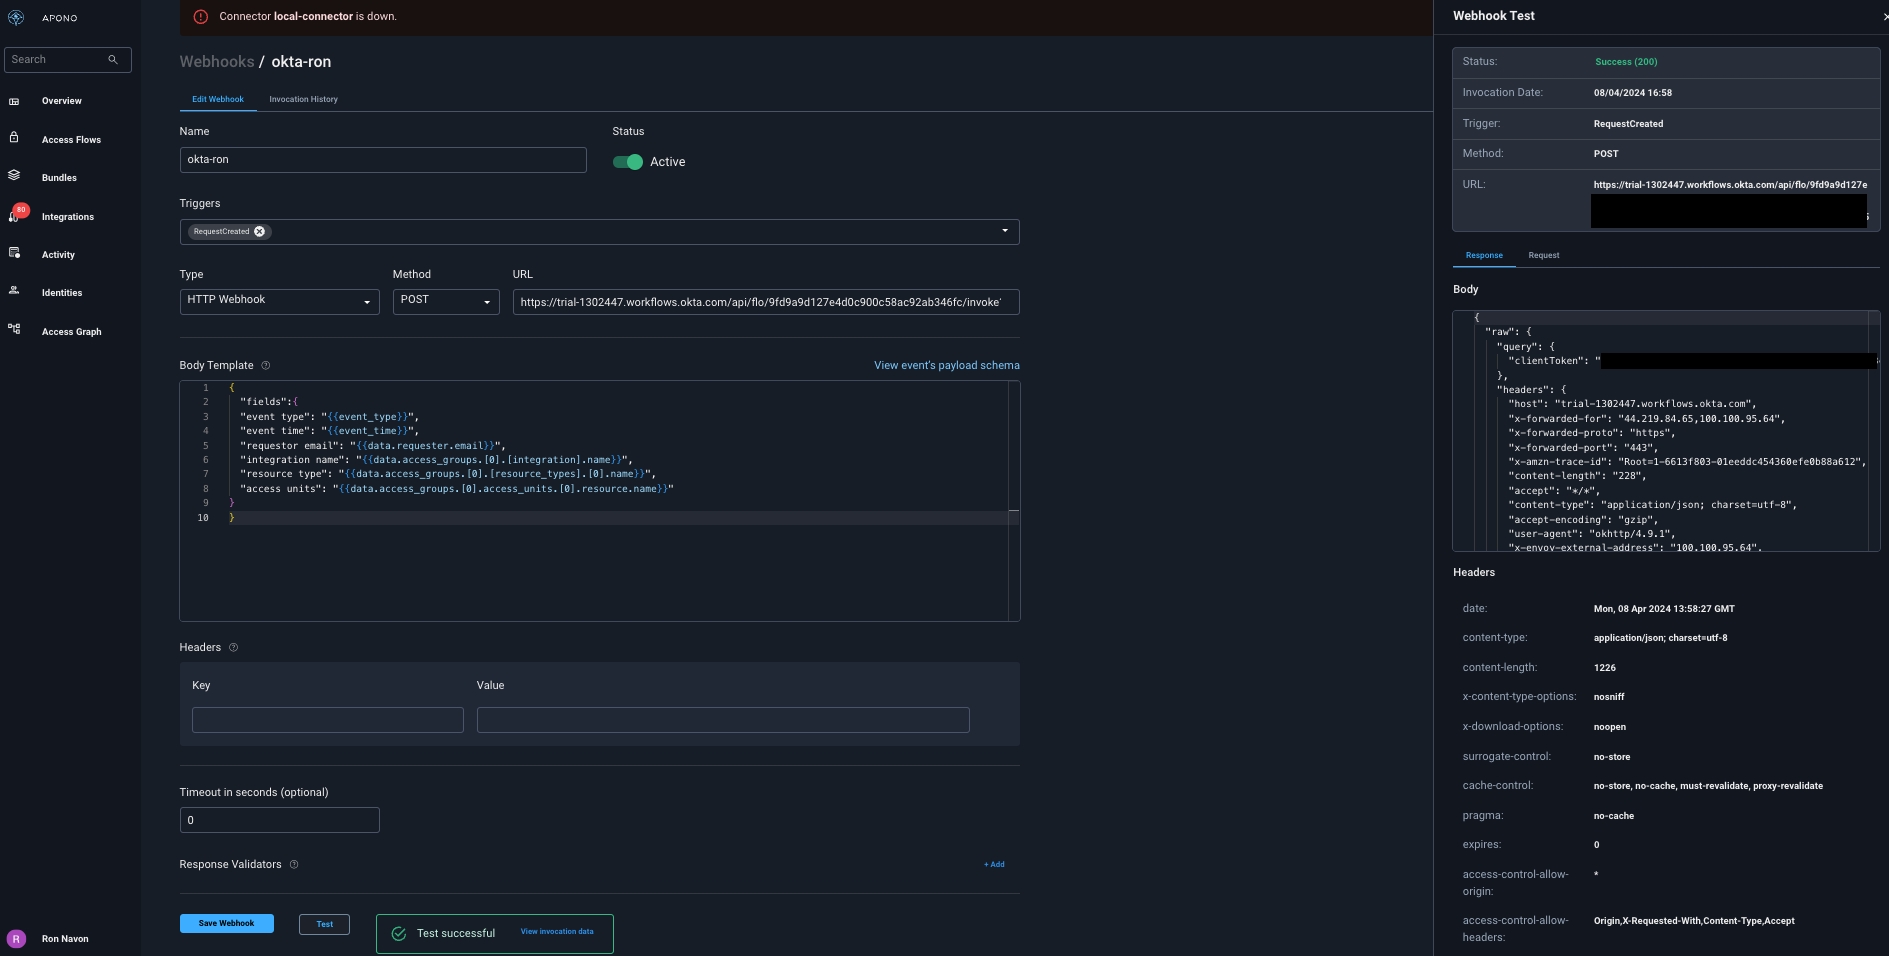
Click Test to generate a test event to trigger your webhook. A Test successful or Test failed response status will appear at the bottom of the page. A successful test will send mock data to the target system.
For more information about the test, click View Invocation Data. A panel opens revealing the request, response, and other relevant details.
Should your test fail, view these tips to troubleshoot your webhook.
Click Save Webhook.
The new webhook appears in the Webhooks table. Active webhooks are preceded by a green dot. Inactive webhooks are preceded by a white dot.
Apono access request logs will be sent to the target system based on the triggers you have selected.
Send Apono access requests data to Teams channels triggered by Apono requests events
Microsoft Teams is a collaboration platform by Microsoft that integrates chat, video conferencing, file storage, and application integration for streamlined teamwork.
Leveraging Apono's webhooks solution, you can send requests' data to a dedicated Teams channel as access is requested, granted and revoked.
Teams account with an active Subscription (Create an Teams account here).
Follow these steps to configure a webhook:
On the Webhooks page, click Add Webhook. The Add Webhook page appears.
Click Request Webhook.
Enter a unique, alphanumeric, user-friendly Request Webhook Name for identifying this webhook.
Click the Status toggle to Active.
From the Method dropdown menu, select POST.
In the URL field, enter the incoming webhook URL.
The webhook URL must adhere to the following requirements:
Uses the HTTPS protocol
Does not specify any custom ports
In the Body Template field, construct a JSON body for the webhook payload.
Click View event's payload schema to reveal the payload schema and available data fields. You can also refer to the Webhook Payload Schema Reference to read the descriptions of each data field.
From the Triggers dropdown menu, select one or more of the following event triggers, which correspond to Apono access request statuses:
RequestCreated
RequestApproved
RequestExpired
RequestFailed
RequestGranted
RequestRejected
Under Filters, define one or several filter from the listed dropdown menus.
Filters empower admins to control the data transmitted via webhooks, minimizing the amount of data third-party tools receive and reducing unnecessary clutter.
Examples:
Send only production requests to your admins' Slack channel.
Trigger Okta workflows for events from specific integrations or resource types.
Open a ticket in Jira or ServiceNow for manually approved requests.
(Optional) In the Timeout in seconds field, enter the duration in seconds to wait before marking the request as failed.
(Optional) Define Response Validators to verify that the response from the webhook meets specified criteria:
Click + Add. A row of settings appears.
Starting with $.data., enter the Json Path of the JSON parameter.
In the Expected Values field, enter a value and press the Enter key on your keyboard.
Repeat step c to add several expected values.
Repeat steps a-d to add multiple response validators.
Click Test to generate a test event to trigger your webhook. A Test successful or Test failed response status will appear at the bottom of the page. A successful test will send mock data to the target system.
For more information about the test, click View Invocation Data. A panel opens revealing the request, response, and other relevant details.
Should your test fail, view these tips to troubleshoot your webhook.
Click Save Webhook.
The new webhook appears in the Webhooks table. Active webhooks are preceded by a green dot. Inactive webhooks are preceded by a white dot.
Apono access request logs will be sent to Teams based on the triggers you have selected.
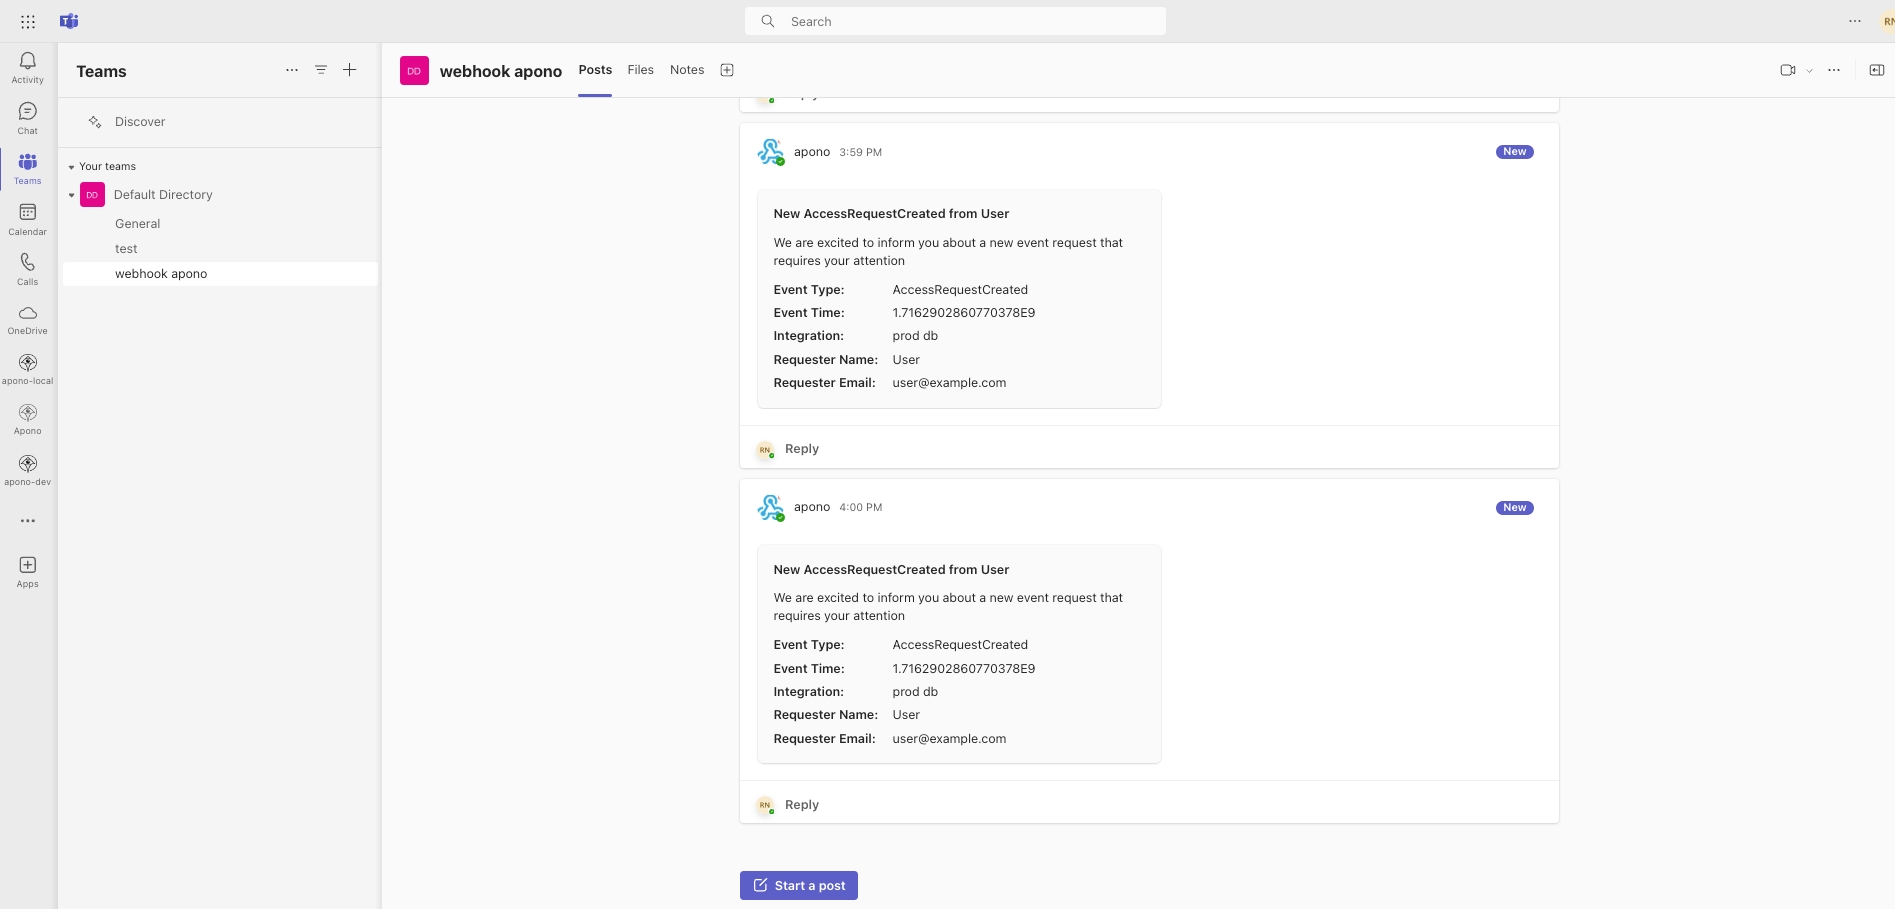
Your webhook should now start sending request event message to your Teams channel once triggered:
Create an outgoing webhook in Apono that will allow to automatically create issues in Jira from Apono access requests
The steps below describe how to create an outgoing webhook in Apono that will allow to automatically create issues in Jira from Apono access requests.
You can automatically create and resolve issues in Jira via outgoing webhooks. This guide provides example webhook configurations for common use cases, as well as information on how to set up a user in Jira to be used by Apono.
A user in Jira to be used by Apono. You'll need the user's email address.
An API token for this user. These credentials will be used to communicate with Jira REST API.
Make sure the user has appropriate permissions to create and update issues in Jira.
What are Jira Basic tokens?
Read more here
Follow these steps to configure an Apono webhook:
On the Webhooks page, click Add Webhook. The Add Webhook page appears.
Click Request Webhook.
Enter a unique, alphanumeric, user-friendly Request Webhook Name for identifying this webhook.
Click the Status toggle to Active.
From the Method dropdown menu, select a REST method.
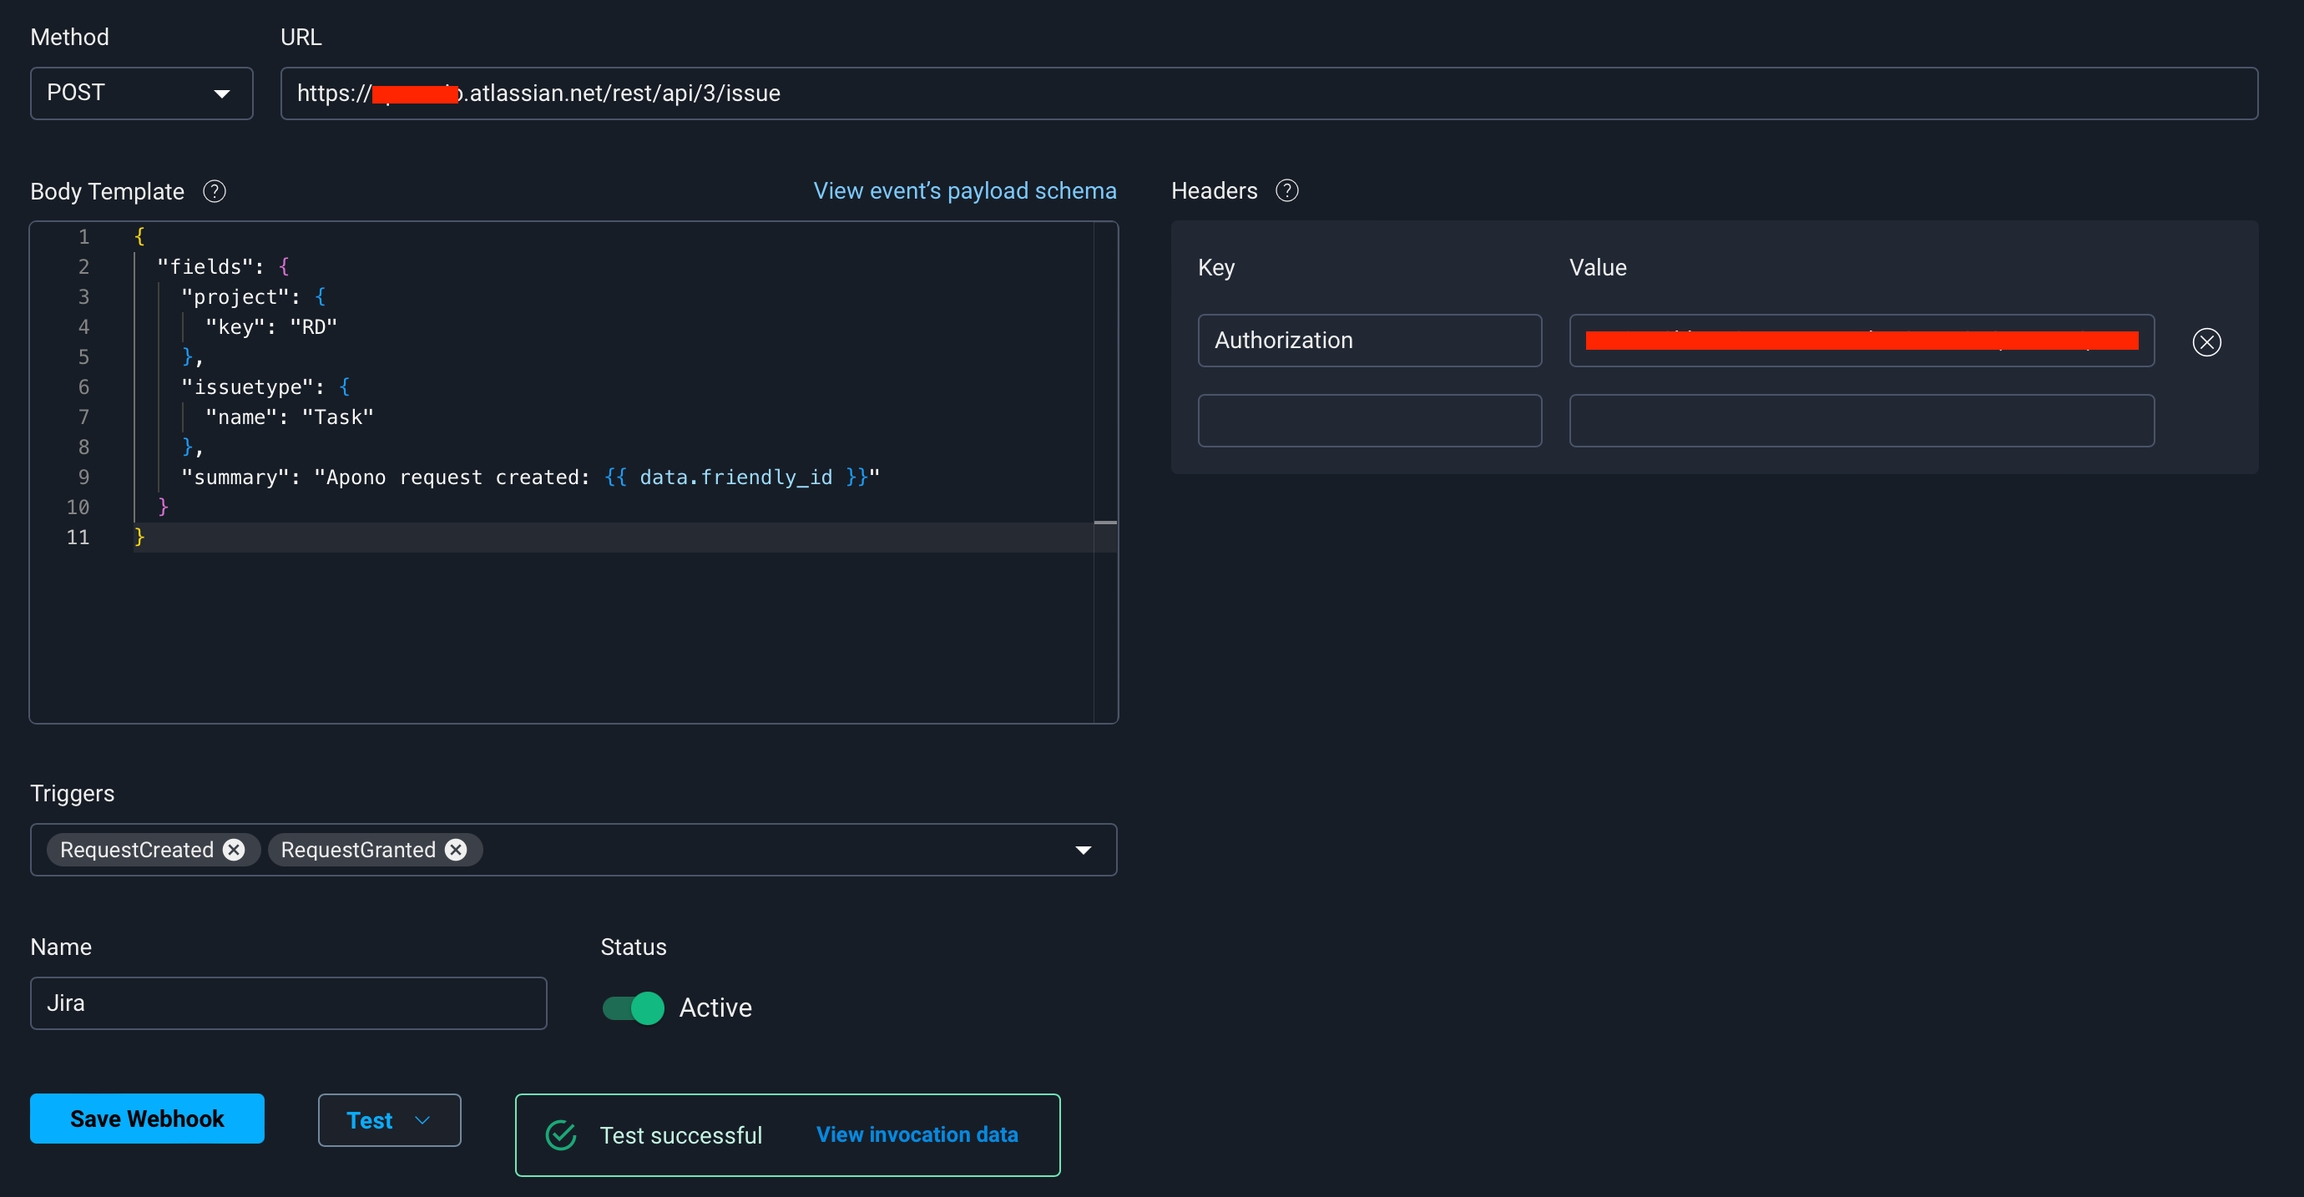
In the URL field, enter https://<DOMAIN>.atlassian.net/rest/api/3/issue.
Be sure to replace <DOMAIN> with your Jira domain.
The webhook URL must adhere to the following requirements:
Uses the HTTPS protocol
Does not specify any custom ports
In the Body Template field, construct a JSON body for the webhook payload.
Click View event's payload schema to reveal the payload schema and available data fields. You can also refer to the Webhook Payload Schema Reference to read the descriptions of each data field.
Under Headers, use the following Key and Value to set the headers required by the target system, such as an authorization header.
Authorization
From the Triggers dropdown menu, select one or more of the following event triggers, which correspond to Apono access request statuses:
RequestCreated
RequestApproved
RequestExpired
RequestFailed
RequestGranted
RequestRejected
Under Filters, define one or several filter from the listed dropdown menus.
Filters empower admins to control the data transmitted via webhooks, minimizing the amount of data third-party tools receive and reducing unnecessary clutter.
Examples:
Send only production requests to your admins' Slack channel.
Trigger Okta workflows for events from specific integrations or resource types.
Open a ticket in Jira or ServiceNow for manually approved requests.
(Optional) In the Timeout in seconds field, enter the duration in seconds to wait before marking the request as failed.
(Optional) Define Response Validators to verify that the response from the webhook meets specified criteria:
Click + Add. A row of settings appears.
Starting with $.data., enter the Json Path of the JSON parameter.
In the Expected Values field, enter a value and press the Enter key on your keyboard.
Repeat step c to add several expected values.
Repeat steps a-d to add multiple response validators.
Click Test to generate a test event to trigger your webhook. A Test successful or Test failed response status will appear at the bottom of the page. A successful test will send mock data to the target system.
For more information about the test, click View Invocation Data. A panel opens revealing the request, response, and other relevant details.
Should your test fail, view these tips to troubleshoot your webhook.
Click Save Webhook.
The new webhook appears in the Webhooks table. Active webhooks are preceded by a green dot. Inactive webhooks are preceded by a white dot.
Apono access request logs will be sent to Jira based on the triggers you have selected.
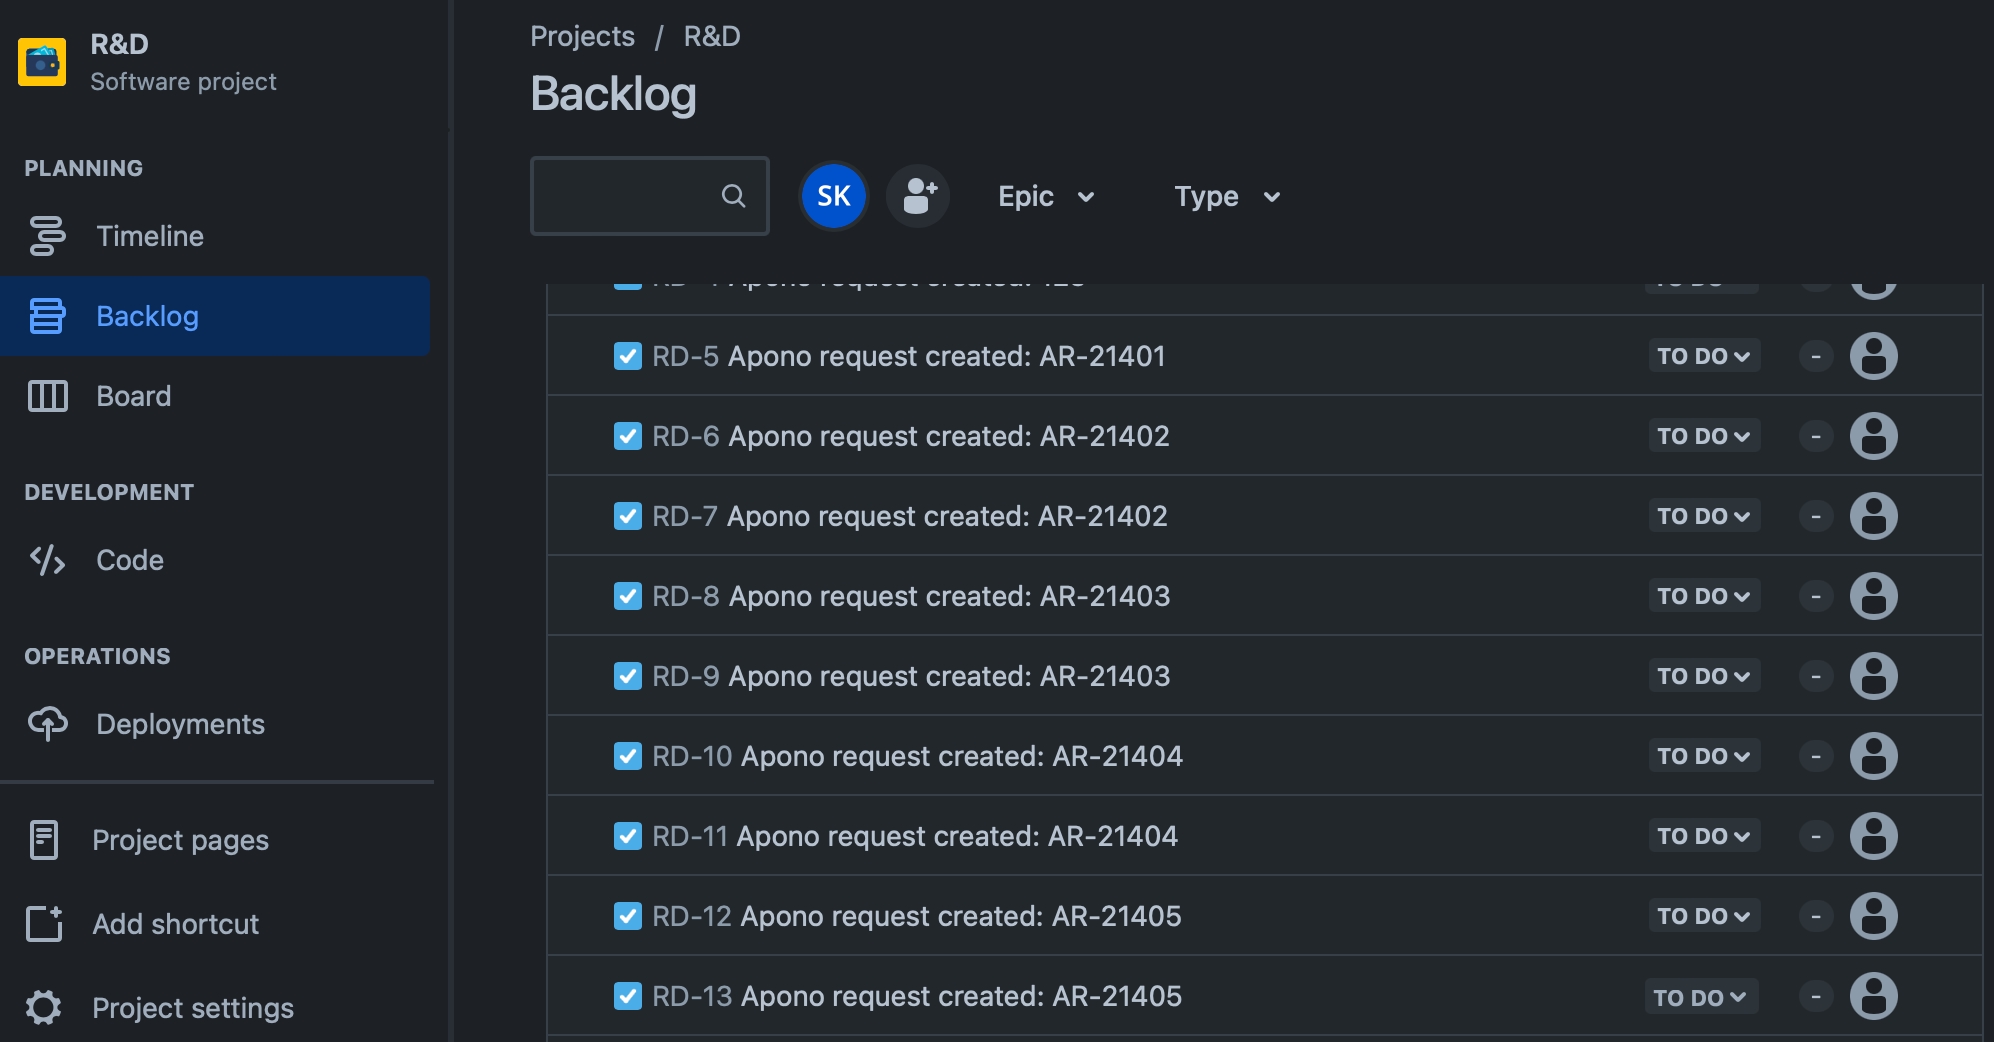
Your webhook should now start creating Jira tickets in the relevant project once triggered:
Create an outgoing webhook in Apono that will send messages in a Slack channel based on an Apono access requests
The steps below describe how to create an outgoing webhook in Apono that will allow to automatically send messages in Slack from Apono access requests.
Create a Slack app or use an existing one
Enable incoming webhooks From your Slack app's management dashboard. Select Incoming Webhooks, and toggle Activate Incoming Webhooks to on.
Create an incoming webhook - Now that incoming webhooks are enabled, the settings page should refresh and a button called Add New Webhook to Workspace will appear.
Pick a channel that the app will post to, then select Authorize. If you need to add the incoming webhook to a private channel, you must be a member of that channel.
You'll be sent back to your app settings, where you should see a new entry under the Webhook URLs for Your Workspace section. Your webhook URL will look something like this: https://hooks.slack.com/services/T00000000/B00000000/XXXXXXXXXXXXXXXXXXXXXXXX
Follow these steps to configure a webhook:
On the Webhooks page, click Add Webhook. The Add Webhook page appears.
Click Request Webhook.
Enter a unique, alphanumeric, user-friendly Request Webhook Name for identifying this webhook.
Click the Status toggle to Active.
From the Method dropdown menu, select POST.
In the URL field, enter https//:hooks.slack.com/services/<T00000000/B00000000/XXXXXXXXXXXXXXXXXXXXXXXX>.
Be sure to replace <T00000000/B00000000/XXXXXXXXXXXXXXXXXXXXXXXX> with the incoming webhook URL values.
The webhook URL must adhere to the following requirements:
Uses the HTTPS protocol
Does not specify any custom ports
In the Body Template field, construct a JSON body for the webhook payload.
Click View event's payload schema to reveal the payload schema and available data fields. You can also refer to the Webhook Payload Schema Reference to read the descriptions of each data field.
From the Triggers dropdown menu, select one or more of the following event triggers, which correspond to Apono access request statuses:
RequestCreated
RequestApproved
RequestExpired
RequestFailed
RequestGranted
RequestRejected
Under Filters, define one or several filter from the listed dropdown menus.
Filters empower admins to control the data transmitted via webhooks, minimizing the amount of data third-party tools receive and reducing unnecessary clutter.
Examples:
Send only production requests to your admins' Slack channel.
Trigger Okta workflows for events from specific integrations or resource types.
Open a ticket in Jira or ServiceNow for manually approved requests.
(Optional) In the Timeout in seconds field, enter the duration in seconds to wait before marking the request as failed.
(Optional) Define Response Validators to verify that the response from the webhook meets specified criteria:
Click + Add. A row of settings appears.
Starting with $.data., enter the Json Path of the JSON parameter.
In the Expected Values field, enter a value and press the Enter key on your keyboard.
Repeat step c to add several expected values.
Repeat steps a-d to add multiple response validators.
Click Test to generate a test event to trigger your webhook. A Test successful or Test failed response status will appear at the bottom of the page. A successful test will send mock data to the target system.
For more information about the test, click View Invocation Data. A panel opens revealing the request, response, and other relevant details.
Should your test fail, view these tips to troubleshoot your webhook.
Click Save Webhook.
The new webhook appears in the Webhooks table. Active webhooks are preceded by a green dot. Inactive webhooks are preceded by a white dot.
Apono access request logs will be sent to Slack based on the triggers you have selected.
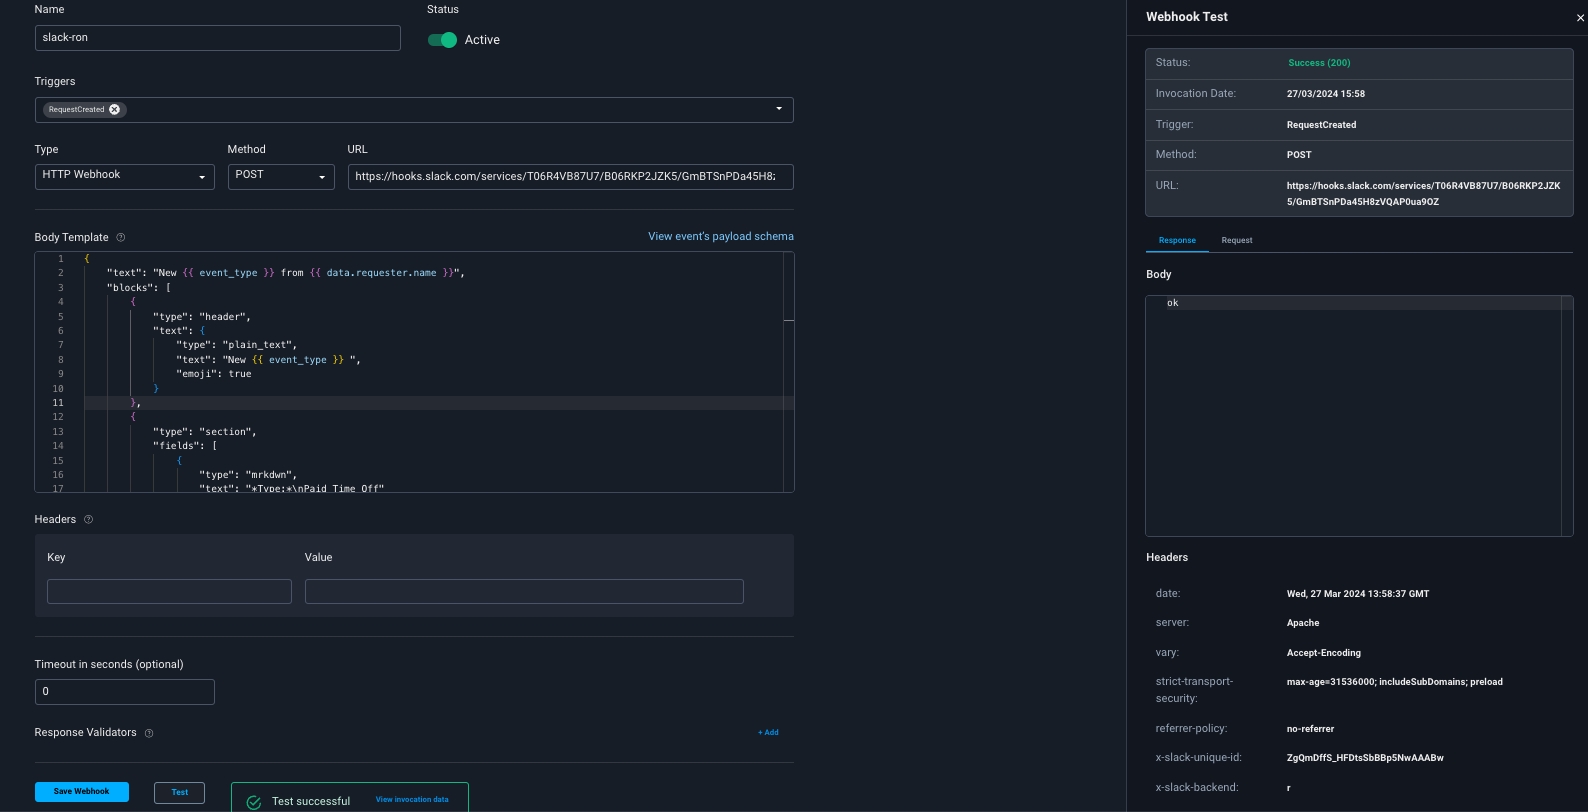
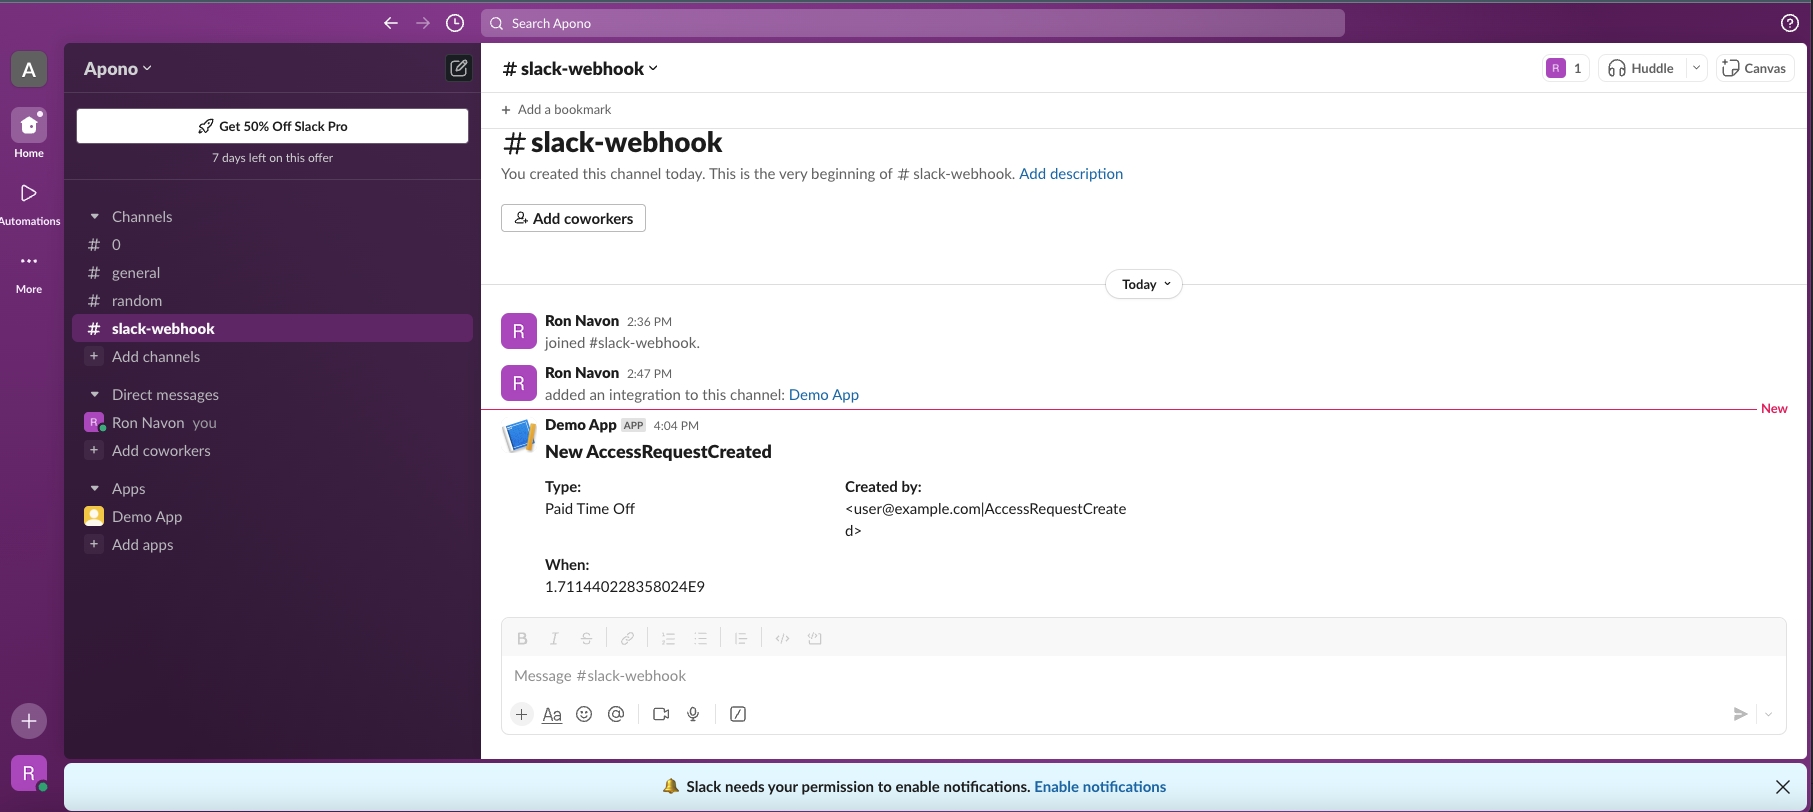
Your webhook should now start sending messages in the webhook Slack channel once triggered:
Create Freshservice tickets using an Apono webhook
Freshservice is an AI-powered, unified IT and employee service management solution that is simple to use and easy to scale. It provides the capabilities required for managing IT services and extends to non-IT teams as well.
Through this integration, you will configure an Apono webhook that creates new tickets in Freshservice when user access requests are created, approved, granted, and revoked, or when requests fail.
and copy the key to use it later
Follow these steps to configure a webhook:
On the page, click Add Webhook. The Add Webhook page appears.
Click Request Webhook.
Enter a unique, alphanumeric, user-friendly Request Webhook Name for identifying this webhook.
Click the Status toggle to Active.
From the Method dropdown menu, select POST.
For the webhook URL, enter https://<DOMAIN>.freshdesk.com/api/v2/tickets.
The Body Template field expects a JSON structure as appears below. For the full JSON scheme for creating a ticket .
For Headers, use the following Key and Value to set the authorization.
From the Triggers dropdown menu, select RequestCreated.
Under Filters, define one or several filter from the listed dropdown menus.
Filters empower admins to control the data transmitted via webhooks, minimizing the amount of data third-party tools receive and reducing unnecessary clutter.
Examples:
Send only production requests to your admins' Slack channel.
Trigger Okta workflows for events from specific integrations or resource types.
Open a ticket in Jira or ServiceNow for manually approved requests.
(Optional) In the Timeout in seconds field, enter the duration in seconds to wait before marking the request as failed.
(Optional) Define Response Validators to verify that the response from the webhook meets specified criteria:
Click + Add. A row of settings appears.
Starting with $.data., enter the Json Path of the JSON parameter.
In the Expected Values field, enter a value and press the Enter key on your keyboard.
Repeat step c to add several expected values.
Repeat steps a-d to add multiple response validators.
Click Test to generate a test event to trigger your webhook. A Test successful or Test failed response status will appear at the bottom of the page. A successful test will send mock data to the target system.
For more information about the test, click View Invocation Data. A panel opens revealing the request, response, and other relevant details.
Click Save Webhook.
The new webhook appears in the Webhooks table. Active webhooks are preceded by a green dot. Inactive webhooks are preceded by a white dot.
Apono will send a call to Freshservice to create a new ticket when the RequestCreated event is triggered.
Your webhook should now start Freshservice ticket once triggered:
Create Freshdesk tickets using an Apono webhook
Freshdesk is a customer support platform that helps businesses efficiently manage and resolve customer inquiries and issues. It provides tools to streamline customer service processes across various channels, such as email, phone, chat, and social media.
Through this integration, you will configure an Apono webhook that creates new tickets in Freshdesk when user access requests are created, approved, granted, and revoked, or when requests fail.
Follow these steps to configure an Apono webhook:
On the page, click Add Webhook. The Add Webhook page appears.
Click Request Webhook.
Enter a unique, alphanumeric, user-friendly Request Webhook Name for identifying this webhook.
Click the Status toggle to Active.
From the Method dropdown menu, select a REST method.
For the webhook URL, enter https://<SUBDOMAIN>.freshdesk.com/api/v2/tickets.
Be sure to replace <SUBDOMAIN> with the Freshdesk subdomain for your account.
The webhook URL must adhere to the following requirements:
Uses the HTTPS protocol
Does not specify any custom ports
In the Body Template field, construct a JSON body for the webhook payload.
From the Triggers dropdown menu, select RequestCreated.
Under Filters, define one or several filter from the listed dropdown menus.
Filters empower admins to control the data transmitted via webhooks, minimizing the amount of data third-party tools receive and reducing unnecessary clutter.
Examples:
Send only production requests to your admins' Slack channel.
Trigger Okta workflows for events from specific integrations or resource types.
Open a ticket in Jira or ServiceNow for manually approved requests.
(Optional) In the Timeout in seconds field, enter the duration in seconds to wait before marking the request as failed.
(Optional) Define Response Validators to verify that the response from the webhook meets specified criteria:
Click + Add. A row of settings appears.
Starting with $.data., enter the Json Path of the JSON parameter.
In the Expected Values field, enter a value and press the Enter key on your keyboard.
Repeat step c to add several expected values.
Repeat steps a-d to add multiple response validators.
Click Test to generate a test event to trigger your webhook. A Test successful or Test failed response status will appear at the bottom of the page. A successful test will send mock data to the target system.
For more information about the test, click View Invocation Data. A panel opens revealing the request, response, and other relevant details.
Click Save Webhook.
The new webhook appears in the Webhooks table. Active webhooks are preceded by a green dot. Inactive webhooks are preceded by a white dot.
Apono will send a call to Freshdesk to create a new ticket when the RequestCreated event is triggered.
Send logs to ServiceNow triggered by Apono Access events
ServiceNow is a cloud-based platform that provides IT service management (ITSM) and business process automation tools. It enables organizations to streamline and automate various workflows, such as IT operations, customer service, and HR.
Follow these steps to configure a ServiceNow webhook:
On the page, click Add Webhook. The Add Webhook page appears.
Click Request Webhook.
Enter a unique, alphanumeric, user-friendly Request Webhook Name for identifying this webhook.
Click the Status toggle to Active.
From the Method dropdown menu, select a REST method.
In the URL field, enter https://<SERVICENOW_INSTANCE_ID>.service-now.com/api/now/table/incident.
Be sure to replace <SERVICENOW_INSTANCE_ID> with the instance ID.
The webhook URL must adhere to the following requirements:
Uses the HTTPS protocol
Does not specify any custom ports
In the Body Template field, construct a JSON body for the webhook payload.
Under Headers, use the following Key and Value to set the header. Be sure to replace <SERVICENOW_TOKEN> with the ServiceNow API token.
From the Triggers dropdown menu, select one or more of the following event triggers, which correspond to Apono access request statuses:
RequestCreated
RequestApproved
RequestExpired
RequestFailed
RequestGranted
RequestRejected
Under Filters, define one or several filter from the listed dropdown menus.
Filters empower admins to control the data transmitted via webhooks, minimizing the amount of data third-party tools receive and reducing unnecessary clutter.
Examples:
Send only production requests to your admins' Slack channel.
Trigger Okta workflows for events from specific integrations or resource types.
Open a ticket in Jira or ServiceNow for manually approved requests.
(Optional) In the Timeout in seconds field, enter the duration in seconds to wait before marking the request as failed.
(Optional) Define Response Validators to verify that the response from the webhook meets specified criteria:
Click + Add. A row of settings appears.
Starting with $.data., enter the Json Path of the JSON parameter.
In the Expected Values field, enter a value and press the Enter key on your keyboard.
Repeat step c to add several expected values.
Repeat steps a-d to add multiple response validators.
Click Test to generate a test event to trigger your webhook. A Test successful or Test failed response status will appear at the bottom of the page. A successful test will send mock data to the target system.
For more information about the test, click View Invocation Data. A panel opens revealing the request, response, and other relevant details.
Click Save Webhook.
The new webhook appears in the Webhooks table. Active webhooks are preceded by a green dot. Inactive webhooks are preceded by a white dot.
Apono access request logs will be sent to ServiceNow based on the triggers you have selected.
Create Zendesk tickets using an Apono webhook
Zendesk is a customer service platform offering tools designed to improve customer engagement and support. It allows businesses to manage customer interactions across multiple channels, including email, social media, and chat.
Through this integration, you will configure an Apono webhook that creates new tickets in Zendesk when user access requests are created, approved, granted, and revoked, or when requests fail.
Follow these steps to configure an Apono webhook:
On the page, click Add Webhook. The Add Webhook page appears.
Click Request Webhook.
Enter a unique, alphanumeric, user-friendly Request Webhook Name for identifying this webhook.
Click the Status toggle to Active.
From the Method dropdown menu, select a REST method.
In the URL field, enter https://<SUBDOMAIN.zendesk.com/api/v2/tickets.
Be sure to replace <SUBDOMAIN> with the Zendesk subdomain for your account.
The webhook URL must adhere to the following requirements:
Uses the HTTPS protocol
Does not specify any custom ports
In the Body Template field, construct a JSON body for the webhook payload.
From the Triggers dropdown menu, select RequestCreated.
Under Filters, define one or several filter from the listed dropdown menus.
Filters empower admins to control the data transmitted via webhooks, minimizing the amount of data third-party tools receive and reducing unnecessary clutter.
Examples:
Send only production requests to your admins' Slack channel.
Trigger Okta workflows for events from specific integrations or resource types.
Open a ticket in Jira or ServiceNow for manually approved requests.
(Optional) In the Timeout in seconds field, enter the duration in seconds to wait before marking the request as failed.
(Optional) Define Response Validators to verify that the response from the webhook meets specified criteria:
Click + Add. A row of settings appears.
Starting with $.data., enter the Json Path of the JSON parameter.
In the Expected Values field, enter a value and press the Enter key on your keyboard.
Repeat step c to add several expected values.
Repeat steps a-d to add multiple response validators.
Click Test to generate a test event to trigger your webhook. A Test successful or Test failed response status will appear at the bottom of the page. A successful test will send mock data to the target system.
For more information about the test, click View Invocation Data. A panel opens revealing the request, response, and other relevant details.
Click Save Webhook.
The new webhook appears in the Webhooks table. Active webhooks are preceded by a green dot. Inactive webhooks are preceded by a white dot.
Apono will send a call to Zendesk to create a new ticket when the RequestCreated event is triggered.
Create ServiceDesk Plus request using an Apono webhook
ServiceDesk Plus is ManageEngine's flagship IT and enterprise service management platform that helps modern enterprises design and deliver critical IT and business services.
Through this integration, you will configure an Apono webhook that creates new request in ServiceDesk Plus when user access requests are created, approved, granted, and revoked, or when requests fail.
and copy the API key to use it later
Follow these steps to configure a webhook:
On the page, click Add Webhook. The Add Webhook page appears.
Click Request Webhook.
Enter a unique, alphanumeric, user-friendly Request Webhook Name for identifying this webhook.
Click the Status toggle to Active.
From the Method dropdown menu, select POST.
For the webhook URL, enter http://<SERVER-NAME>:<PORT>/api/v3/requests
The Body Template field expects a JSON structure as appears below. For the full JSON scheme for creating a ticket .
For Headers, use the following Key and Value to set the authorization.
From the Triggers dropdown menu, select one or more of the following event triggers, which correspond to Apono access request statuses:
RequestCreated
RequestApproved
RequestExpired
RequestFailed
RequestGranted
RequestRejected
Under Filters, define one or several filter from the listed dropdown menus.
Filters empower admins to control the data transmitted via webhooks, minimizing the amount of data third-party tools receive and reducing unnecessary clutter.
Examples:
Send only production requests to your admins' Slack channel.
Trigger Okta workflows for events from specific integrations or resource types.
Open a ticket in Jira or ServiceNow for manually approved requests.
(Optional) In the Timeout in seconds field, enter the duration in seconds to wait before marking the request as failed.
(Optional) Define Response Validators to verify that the response from the webhook meets specified criteria:
Click + Add. A row of settings appears.
Starting with $.data., enter the Json Path of the JSON parameter.
In the Expected Values field, enter a value and press the Enter key on your keyboard.
Repeat step c to add several expected values.
Repeat steps a-d to add multiple response validators.
Click Test to generate a test event to trigger your webhook. A Test successful or Test failed response status will appear at the bottom of the page. A successful test will send mock data to the target system.
For more information about the test, click View Invocation Data. A panel opens revealing the request, response, and other relevant details.
Click Save Webhook.
The new webhook appears in the Webhooks table. Active webhooks are preceded by a green dot. Inactive webhooks are preceded by a white dot.
Apono access request will be created on ServiceDesk Plus based on the triggers you have selected.
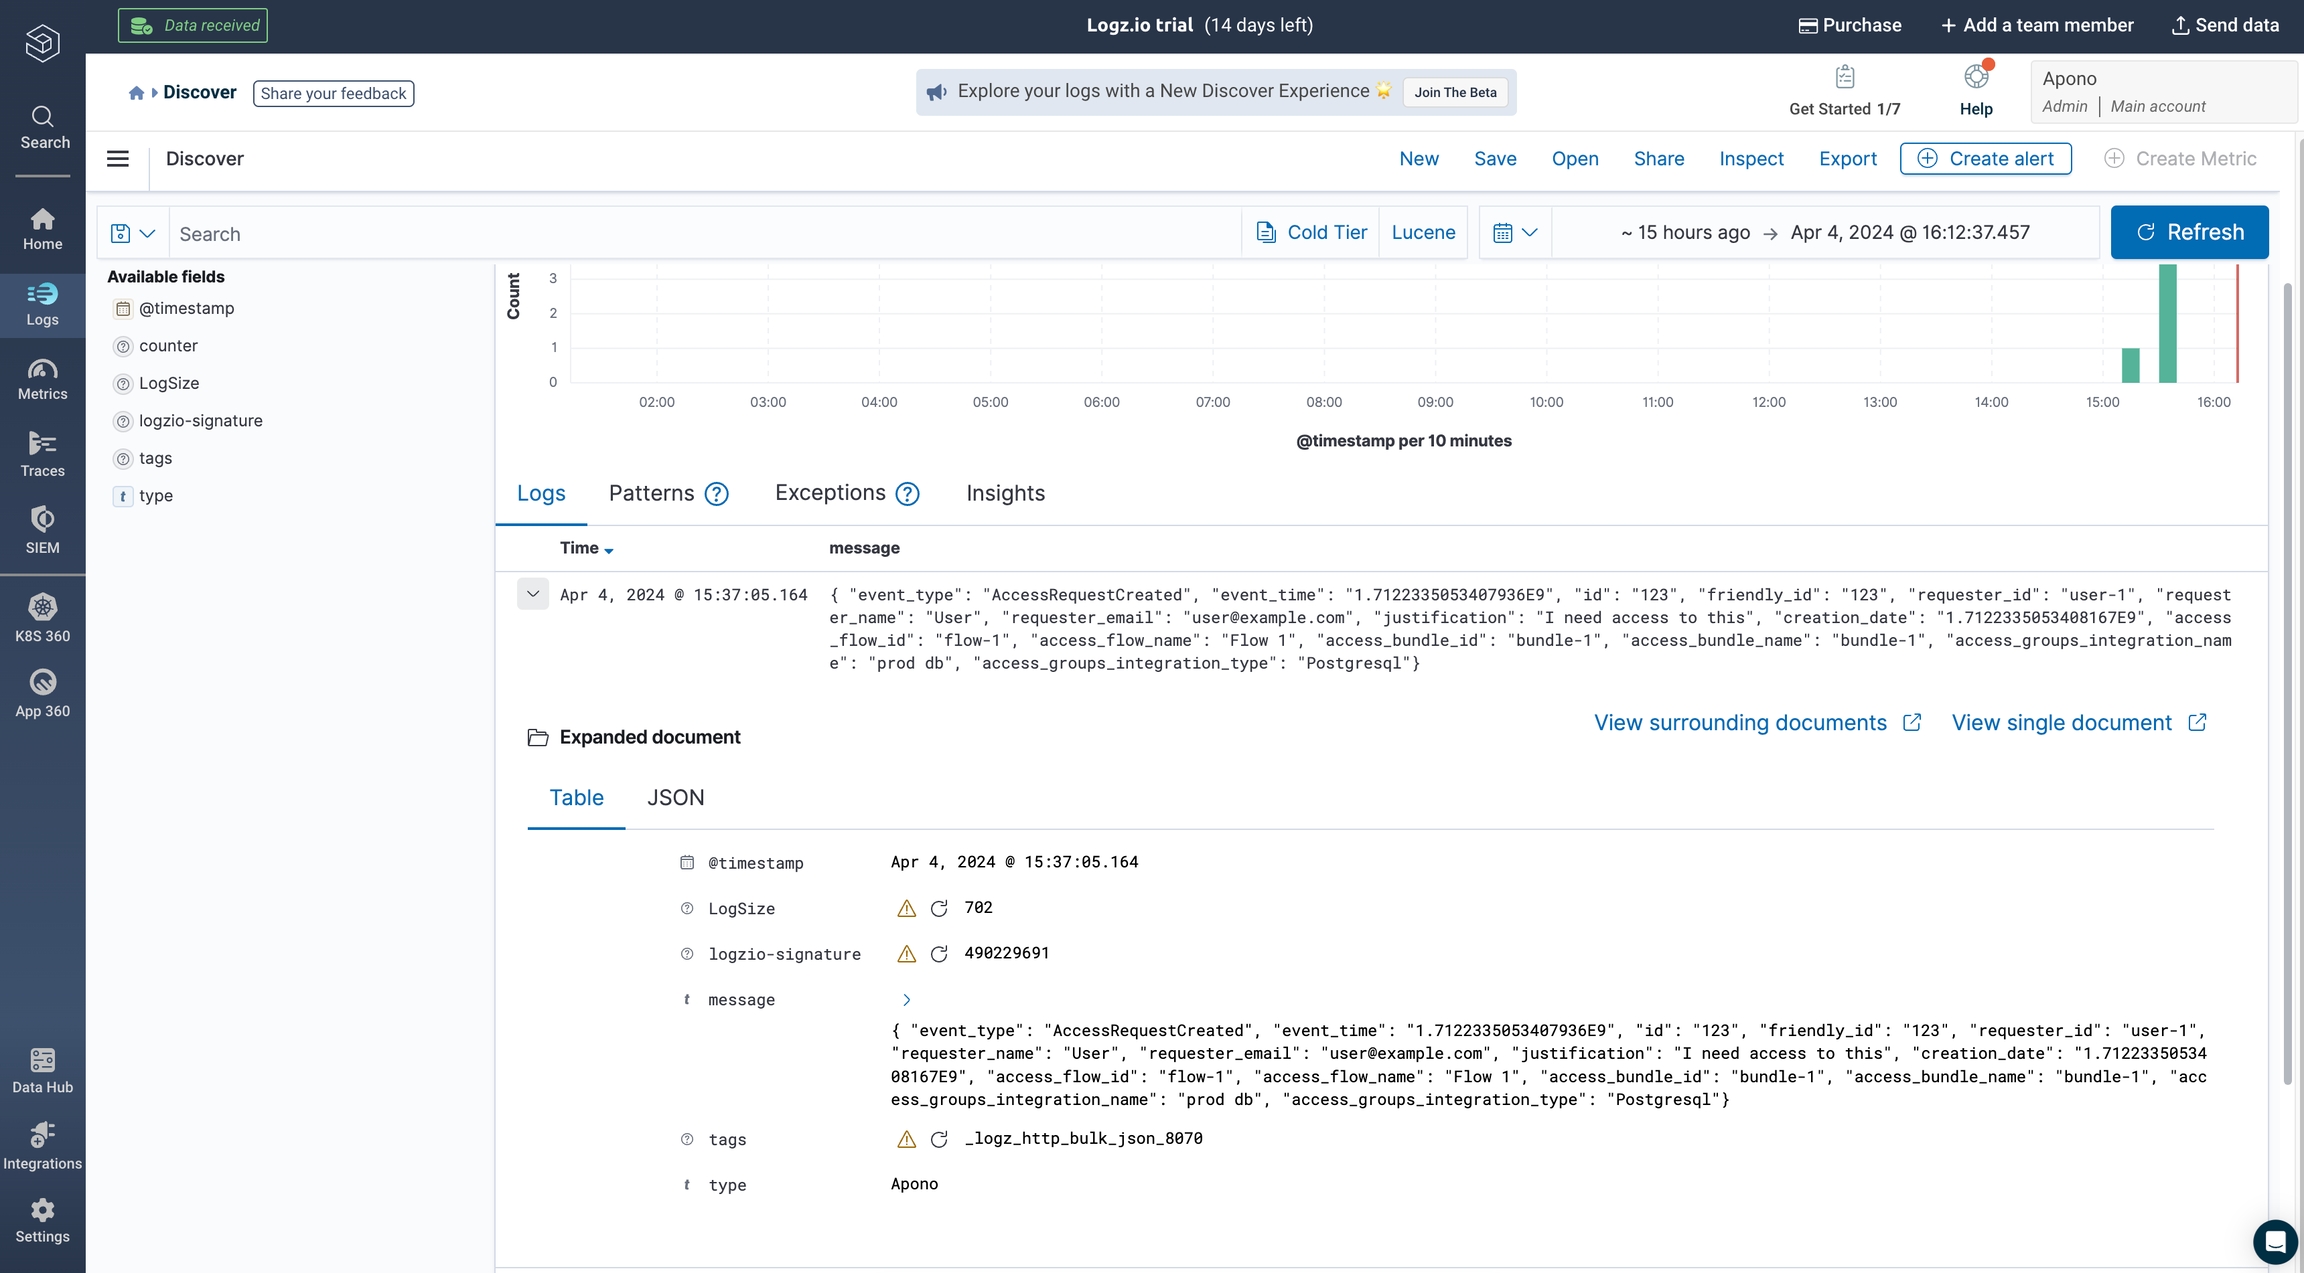
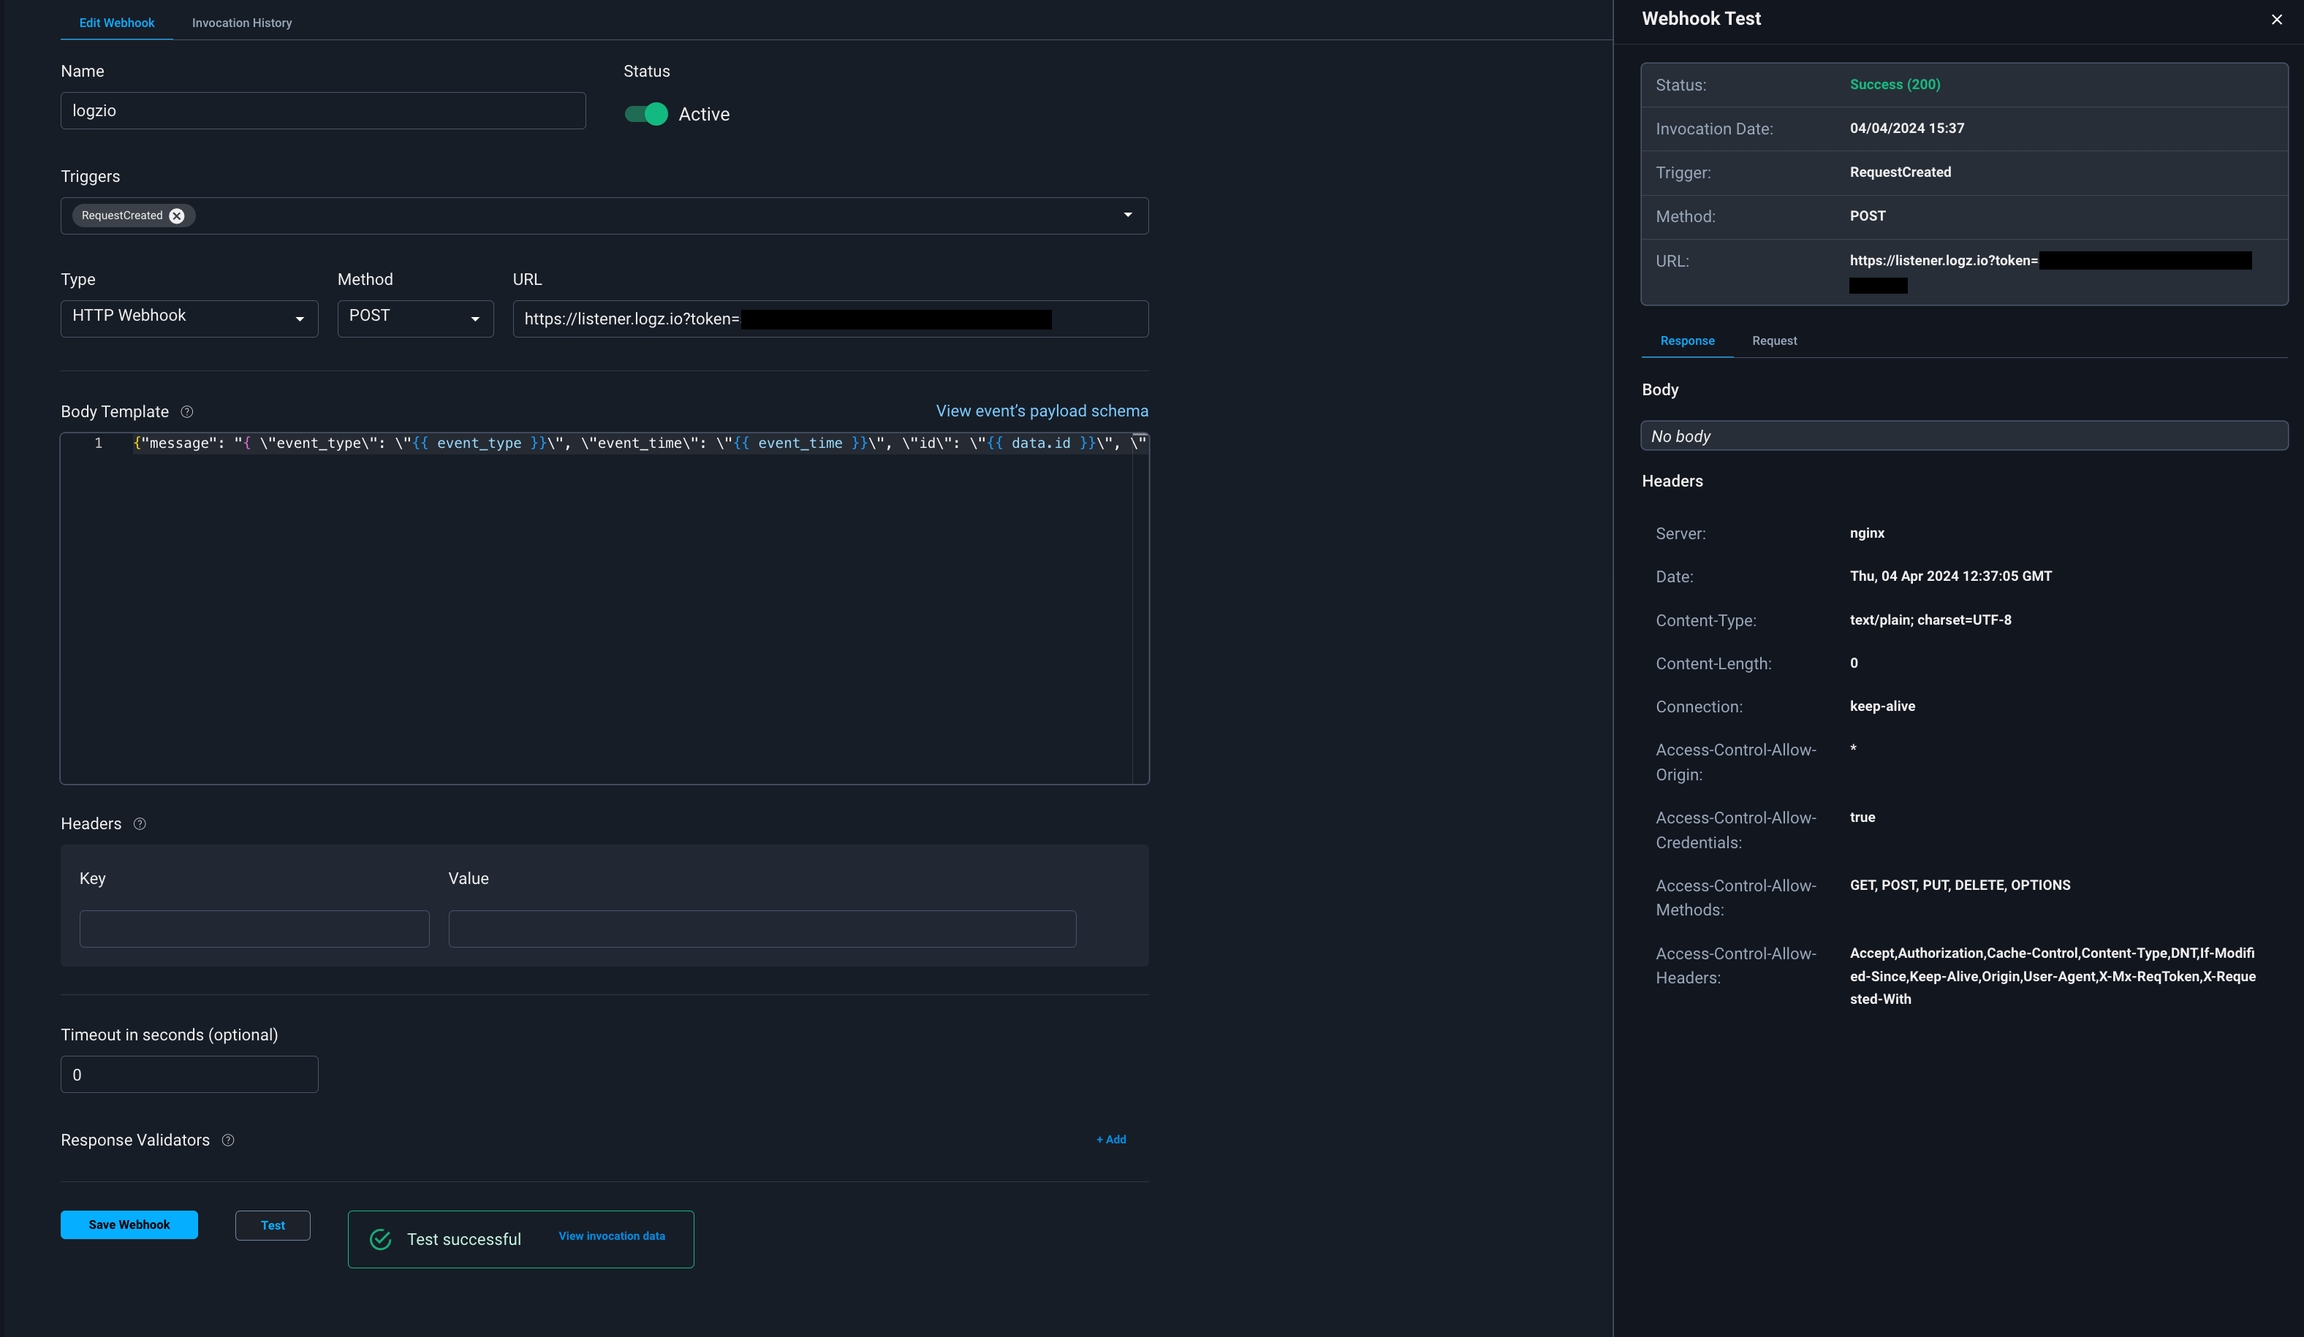
Create an outgoing webhook to send logs to Logz.io triggered by Apono access request events
Logz.io collects and analyze logs, metrics, and traces, combined with human-powered AI/ML features through a SaaS-based data analytics platform.
Logz.io Listener URL location:
Follow these steps to configure an Apono webhook:
Click Request Webhook.
Enter a unique, alphanumeric, user-friendly Request Webhook Name for identifying this webhook.
Click the Status toggle to Active.
From the Method dropdown menu, select POST.
In the URL field, enter https://<LISTENER_URL>?token=<LOG_SHIPPING_TOKEN>.
Be sure to replace the <LISTENER_URL> and <LOG_SHIPPING_TOKEN> placeholders.
The webhook URL must adhere to the following requirements:
Uses the HTTPS protocol
Does not specify any custom ports
In the Body Template field, construct a JSON body for the webhook payload.
From the Triggers dropdown menu, select one or more of the following event triggers, which correspond to Apono access request statuses:
RequestCreated
RequestApproved
RequestExpired
RequestFailed
RequestGranted
RequestRejected
Under Filters, define one or several filter from the listed dropdown menus.
Filters empower admins to control the data transmitted via webhooks, minimizing the amount of data third-party tools receive and reducing unnecessary clutter.
Examples:
Send only production requests to your admins' Slack channel.
Trigger Okta workflows for events from specific integrations or resource types.
Open a ticket in Jira or ServiceNow for manually approved requests.
(Optional) In the Timeout in seconds field, enter the duration in seconds to wait before marking the request as failed.
(Optional) Define Response Validators to verify that the response from the webhook meets specified criteria:
Click + Add. A row of settings appears.
Starting with $.data., enter the Json Path of the JSON parameter.
In the Expected Values field, enter a value and press the Enter key on your keyboard.
Repeat step c to add several expected values.
Repeat steps a-d to add multiple response validators.
Click Test to generate a test event to trigger your webhook. A Test successful or Test failed response status will appear at the bottom of the page. A successful test will send mock data to the target system.
For more information about the test, click View Invocation Data. A panel opens revealing the request, response, and other relevant details.
Click Save Webhook.
The new webhook appears in the Webhooks table. Active webhooks are preceded by a green dot. Inactive webhooks are preceded by a white dot.
Apono access request logs will be sent to Logz.io based on the triggers you have selected.
Your webhook should now start sending logs to Logz.io in the relevant account once triggered:
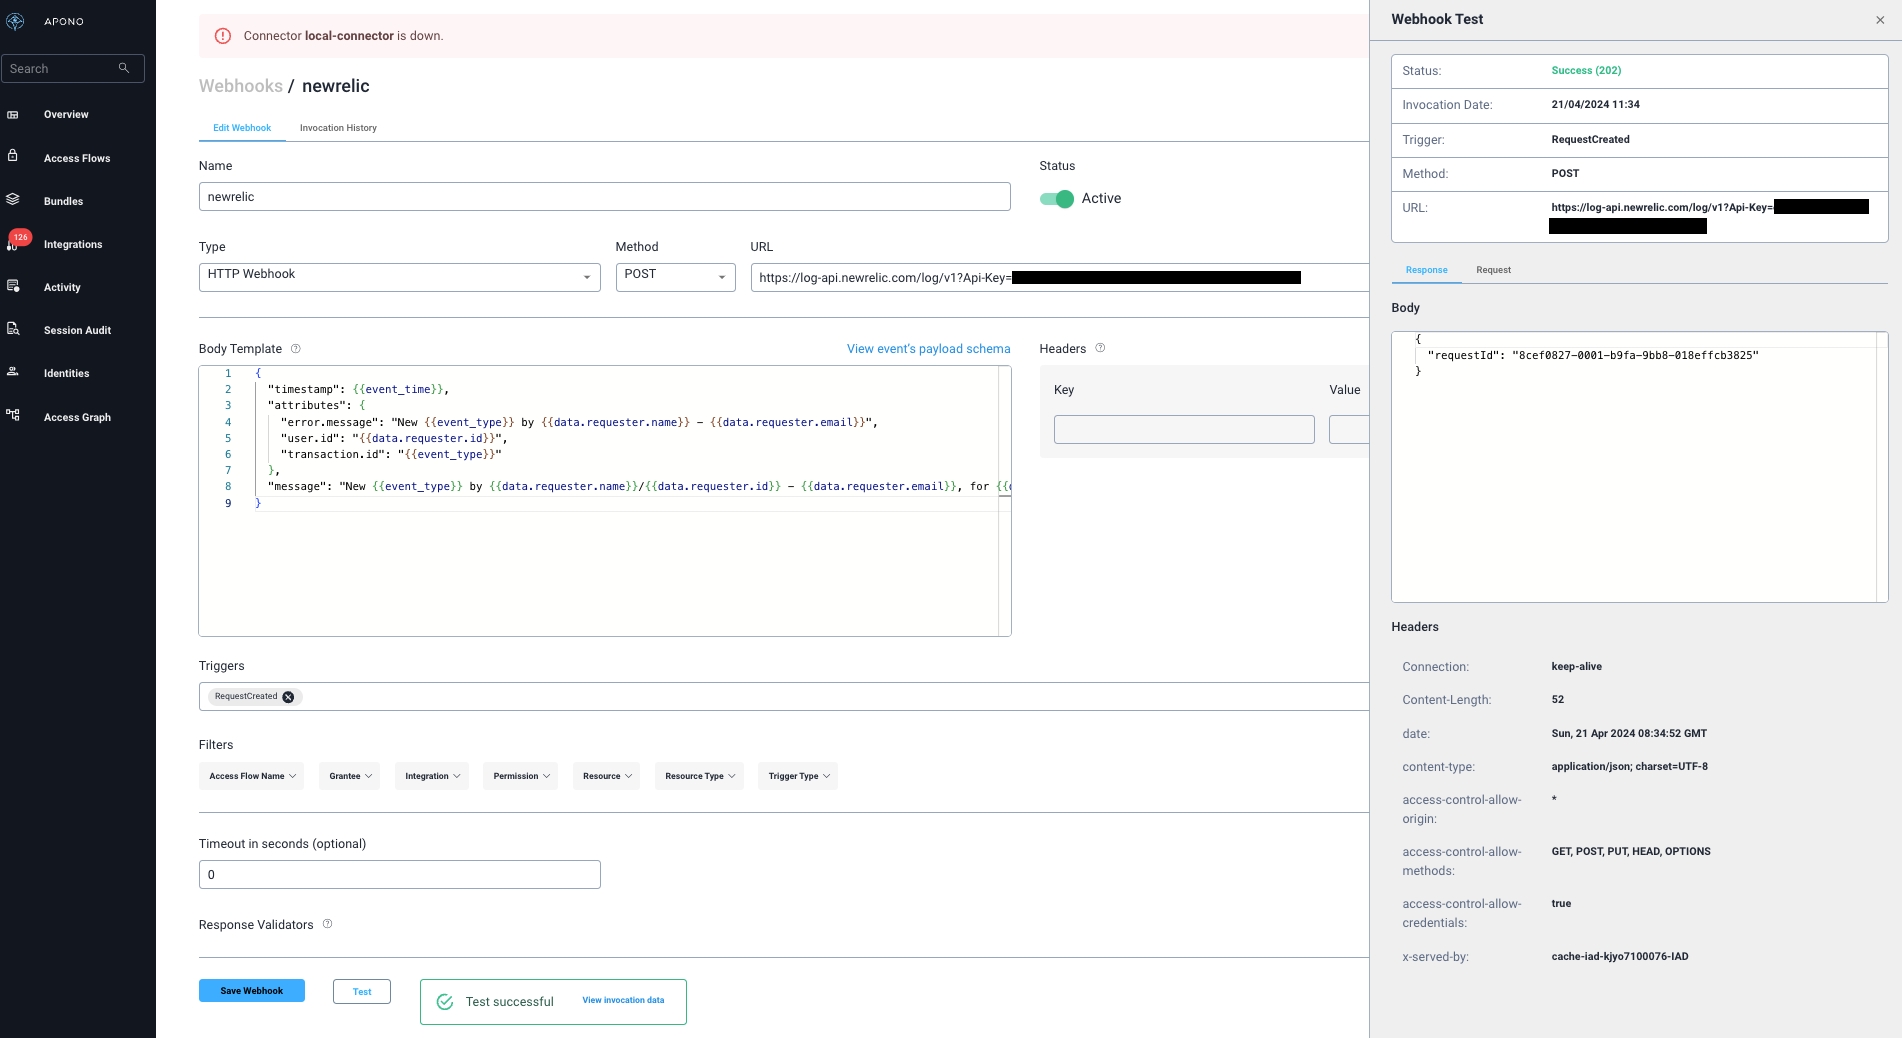
Create an outgoing webhook to send logs to New Relic triggered by Apono access request events
New Relic browser monitoring helps you understand website performance and user behavior by monitoring real user data. It tracks page load times, network requests, JavaScript errors, user interactions, and more. Analyzing navigation timing helps you find issues that hurt your web app's performance or backend errors.
New Relic license location:
Follow these steps to configure a webhook:
Click Request Webhook.
Enter a unique, alphanumeric, user-friendly Request Webhook Name for identifying this webhook.
Click the Status toggle to Active.
From the Method dropdown menu, select POST.
In the URL field, enter https://log-api.newrelic.com/log/v1?Api-Key=<LICENSE_TOKEN>.
Be sure to replace the <LICENSE_TOKEN> placeholder.
The webhook URL must adhere to the following requirements:
Uses the HTTPS protocol
Does not specify any custom ports
In the Body Template field, construct a JSON body for the webhook payload.
From the Triggers dropdown menu, select one or more of the following event triggers, which correspond to Apono access request statuses:
RequestCreated
RequestApproved
RequestExpired
RequestFailed
RequestGranted
RequestRejected
Under Filters, define one or several filter from the listed dropdown menus.
Filters empower admins to control the data transmitted via webhooks, minimizing the amount of data third-party tools receive and reducing unnecessary clutter.
Examples:
Send only production requests to your admins' Slack channel.
Trigger Okta workflows for events from specific integrations or resource types.
Open a ticket in Jira or ServiceNow for manually approved requests.
(Optional) In the Timeout in seconds field, enter the duration in seconds to wait before marking the request as failed.
(Optional) Define Response Validators to verify that the response from the webhook meets specified criteria:
Click + Add. A row of settings appears.
Starting with $.data., enter the Json Path of the JSON parameter.
In the Expected Values field, enter a value and press the Enter key on your keyboard.
Repeat step c to add several expected values.
Repeat steps a-d to add multiple response validators.
Click Test to generate a test event to trigger your webhook. A Test successful or Test failed response status will appear at the bottom of the page. A successful test will send mock data to the target system.
For more information about the test, click View Invocation Data. A panel opens revealing the request, response, and other relevant details.
Click Save Webhook.
The new webhook appears in the Webhooks table. Active webhooks are preceded by a green dot. Inactive webhooks are preceded by a white dot.
Apono access request logs will be sent to New Relic based on the triggers you have selected.
Your webhook should now start sending logs to New Relic in the relevant account once triggered:
Create an outgoing webhook to send logs to Datadog triggered by Apono access request events
Datadog monitors your servers, databases, tools, and services, through a SaaS-based data analytics platform.
This guide shows you how to configure and test outbound webhooks for Datadog.
Follow these steps to configure a webhook:
On the page, click Add Webhook. The Add Webhook page appears.
Click Request Webhook.
Enter a unique, alphanumeric, user-friendly Request Webhook Name for identifying this webhook.
Click the Status toggle to Active.
From the Method dropdown menu, select POST.
For the webhook URL, enter https://<DATADOG_LOG_COLLECTOR_URL>/api/v2/logs.
Be sure to replace <DATADOG_LOG_COLLECTOR_URL> with your . For example, for the US5 region, enter: https://http-intake.logs.us5.datadoghq.com
The webhook URL must adhere to the following requirements:
Uses the HTTPS protocol
Does not specify any custom ports
In the Body Template field, paste the following JSON body for the webhook payload. Replace LOGS_TAGS with a comma-separated list of tags you want to associate with your logs. For example env:staging,version:5.1.
From the Triggers dropdown menu, select one or more of the following event triggers, which correspond to Apono access request statuses:
RequestCreated
RequestApproved
RequestExpired
RequestFailed
RequestGranted
RequestRejected
Under Filters, define one or several filter from the listed dropdown menus.
Filters empower admins to control the data transmitted via webhooks, minimizing the amount of data third-party tools receive and reducing unnecessary clutter.
Examples:
Send only production requests to your admins' Slack channel.
Trigger Okta workflows for events from specific integrations or resource types.
Open a ticket in Jira or ServiceNow for manually approved requests.
(Optional) In the Timeout in seconds field, enter the duration in seconds to wait before marking the request as failed.
(Optional) Define Response Validators to verify that the response from the webhook meets specified criteria:
Click + Add. A row of settings appears.
Starting with $.data., enter the Json Path of the JSON parameter.
In the Expected Values field, enter a value and press the Enter key on your keyboard.
Repeat step c to add several expected values.
Repeat steps a-d to add multiple response validators.
Click Test to generate a test event to trigger your webhook. A Test successful or Test failed response status will appear at the bottom of the page. A successful test will send mock data to the target system.
For more information about the test, click View Invocation Data. A panel opens revealing the request, response, and other relevant details.
Click Save Webhook.
The new webhook appears in the Webhooks table. Active webhooks are preceded by a green dot. Inactive webhooks are preceded by a white dot.
Apono access request logs will be sent to Datadog based on the triggers you have selected.
Create an outgoing webhook to create incidents to Grafana triggered by Apono access request events
Grafana allows you to query, visualize, alert on, and understand your metrics no matter where they are stored. Create, explore, and share dashboards with your team and foster a data-driven culture.
Follow these steps to configure an Apono webhook:
Click Request Webhook.
Enter a unique, alphanumeric, user-friendly Request Webhook Name for identifying this webhook.
Click the Status toggle to Active.
From the Method dropdown menu, select POST.
In the URL field, enter https://<INCOMING_WEBHOOK_URL>?title=json(title).
Be sure to replace the <INCOMING_WEBHOOK_URL> placeholder.
The webhook URL must adhere to the following requirements:
Uses the HTTPS protocol
Does not specify any custom ports
In the Body Template field, construct a JSON body for the webhook payload.
Under Headers, use the following Key and Value to set the header. Be sure to replace the <INCOMING_WEBHOOK_TOKEN> placeholder.
From the Triggers dropdown menu, select one or more of the following event triggers, which correspond to Apono access request statuses:
RequestCreated
RequestApproved
RequestExpired
RequestFailed
RequestGranted
RequestRejected
Under Filters, define one or several filter from the listed dropdown menus.
Filters empower admins to control the data transmitted via webhooks, minimizing the amount of data third-party tools receive and reducing unnecessary clutter.
Examples:
Send only production requests to your admins' Slack channel.
Trigger Okta workflows for events from specific integrations or resource types.
Open a ticket in Jira or ServiceNow for manually approved requests.
(Optional) In the Timeout in seconds field, enter the duration in seconds to wait before marking the request as failed.
(Optional) Define Response Validators to verify that the response from the webhook meets specified criteria:
Click + Add. A row of settings appears.
Starting with $.data., enter the Json Path of the JSON parameter.
In the Expected Values field, enter a value and press the Enter key on your keyboard.
Repeat step c to add several expected values.
Repeat steps a-d to add multiple response validators.
Click Test to generate a test event to trigger your webhook. A Test successful or Test failed response status will appear at the bottom of the page. A successful test will send mock data to the target system.
For more information about the test, click View Invocation Data. A panel opens revealing the request, response, and other relevant details.
Click Save Webhook.
The new webhook appears in the Webhooks table. Active webhooks are preceded by a green dot. Inactive webhooks are preceded by a white dot.
Apono access request logs will be sent to Grafana based on the triggers you have selected.
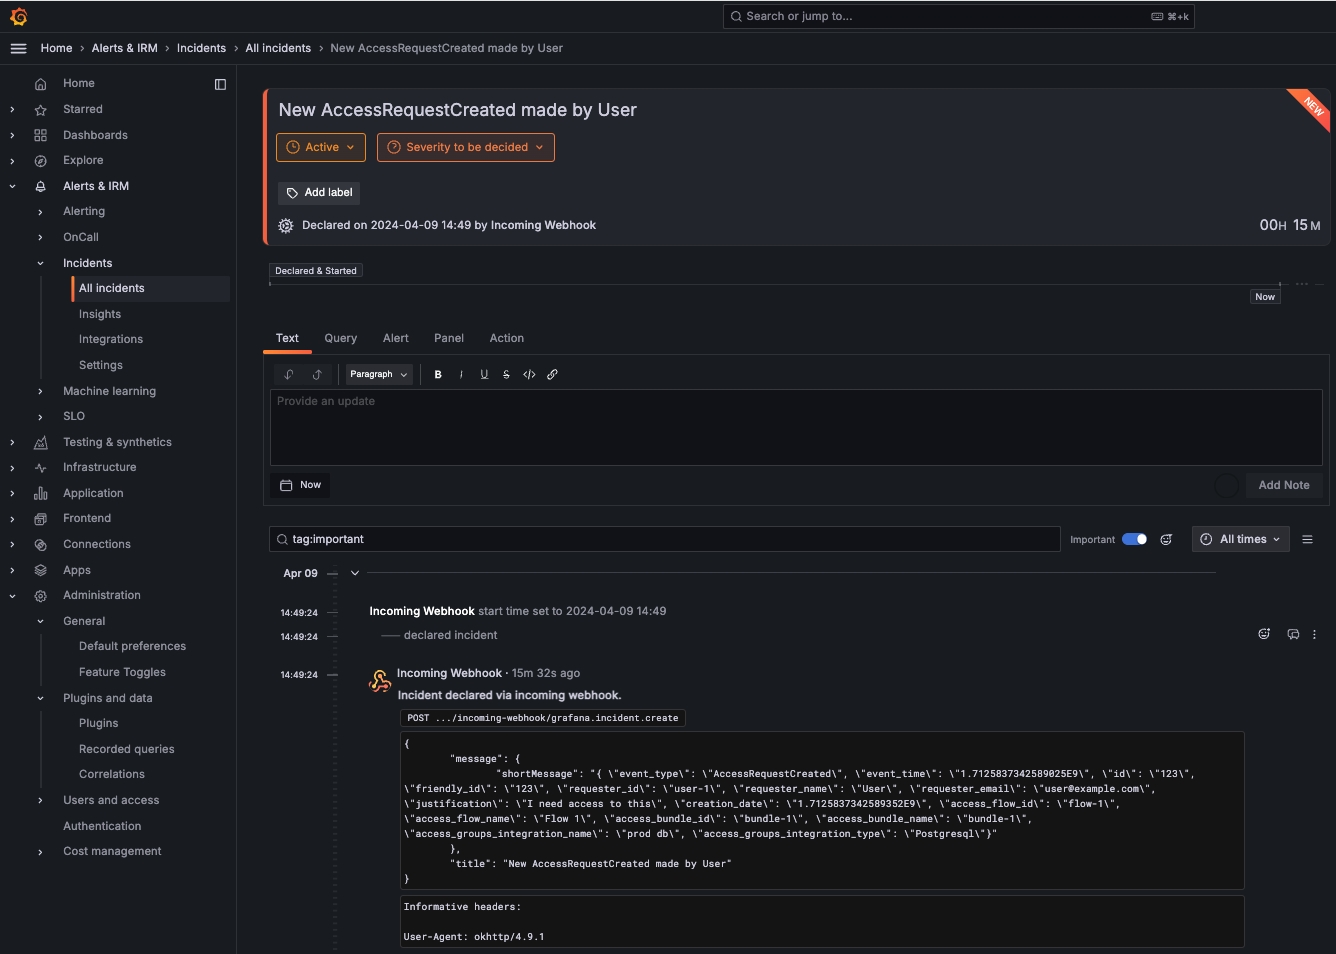
Your webhook should now start creating new incidents to Grafana once triggered:
Create an outgoing webhook to send logs to Coralogix triggered by Apono access request events.
Coralogix is a log analytics platform that uses machine learning and real-time streaming to provide insights into log data, helping with monitoring, troubleshooting, and optimization. It offers features like dynamic data parsing, alerting, and anomaly detection, allowing teams to efficiently manage and analyze large volumes of log data. Coralogix is known for its scalability and robust analytics capabilities.
Follow these steps to configure a webhook:
Click Request Webhook.
Enter a unique, alphanumeric, user-friendly Request Webhook Name for identifying this webhook.
Click the Status toggle to Active.
From the Method dropdown menu, select POST.
In the URL field, enter https://<GENERATED_INCOMING_WEBHOOK_URL>.
Be sure to replace <GENERATED_INCOMING_WEBHOOK_URL> with the Coralogix incoming webhook URL.
The webhook URL must adhere to the following requirements:
Uses the HTTPS protocol
Does not specify any custom ports
In the Body Template field, construct a JSON body for the webhook payload.
Under Headers, use the following Key and Value to set the header. Be sure to replace <API_KEY> with the Coralogix API key.
From the Triggers dropdown menu, select one or more of the following event triggers, which correspond to Apono access request statuses:
RequestCreated
RequestApproved
RequestExpired
RequestFailed
RequestGranted
RequestRejected
Under Filters, define one or several filter from the listed dropdown menus.
Filters empower admins to control the data transmitted via webhooks, minimizing the amount of data third-party tools receive and reducing unnecessary clutter.
Examples:
Send only production requests to your admins' Slack channel.
Trigger Okta workflows for events from specific integrations or resource types.
Open a ticket in Jira or ServiceNow for manually approved requests.
(Optional) In the Timeout in seconds field, enter the duration in seconds to wait before marking the request as failed.
(Optional) Define Response Validators to verify that the response from the webhook meets specified criteria:
Click + Add. A row of settings appears.
Starting with $.data., enter the Json Path of the JSON parameter.
In the Expected Values field, enter a value and press the Enter key on your keyboard.
Repeat step c to add several expected values.
Repeat steps a-d to add multiple response validators.
Click Test to generate a test event to trigger your webhook. A Test successful or Test failed response status will appear at the bottom of the page. A successful test will send mock data to the target system.
For more information about the test, click View Invocation Data. A panel opens revealing the request, response, and other relevant details.
Click Save Webhook.
The new webhook appears in the Webhooks table. Active webhooks are preceded by a green dot. Inactive webhooks are preceded by a white dot.
Apono access request logs will be sent to Coralogix based on the triggers you have selected.
Your webhook should now start sending new logs to Coralogix once triggered:
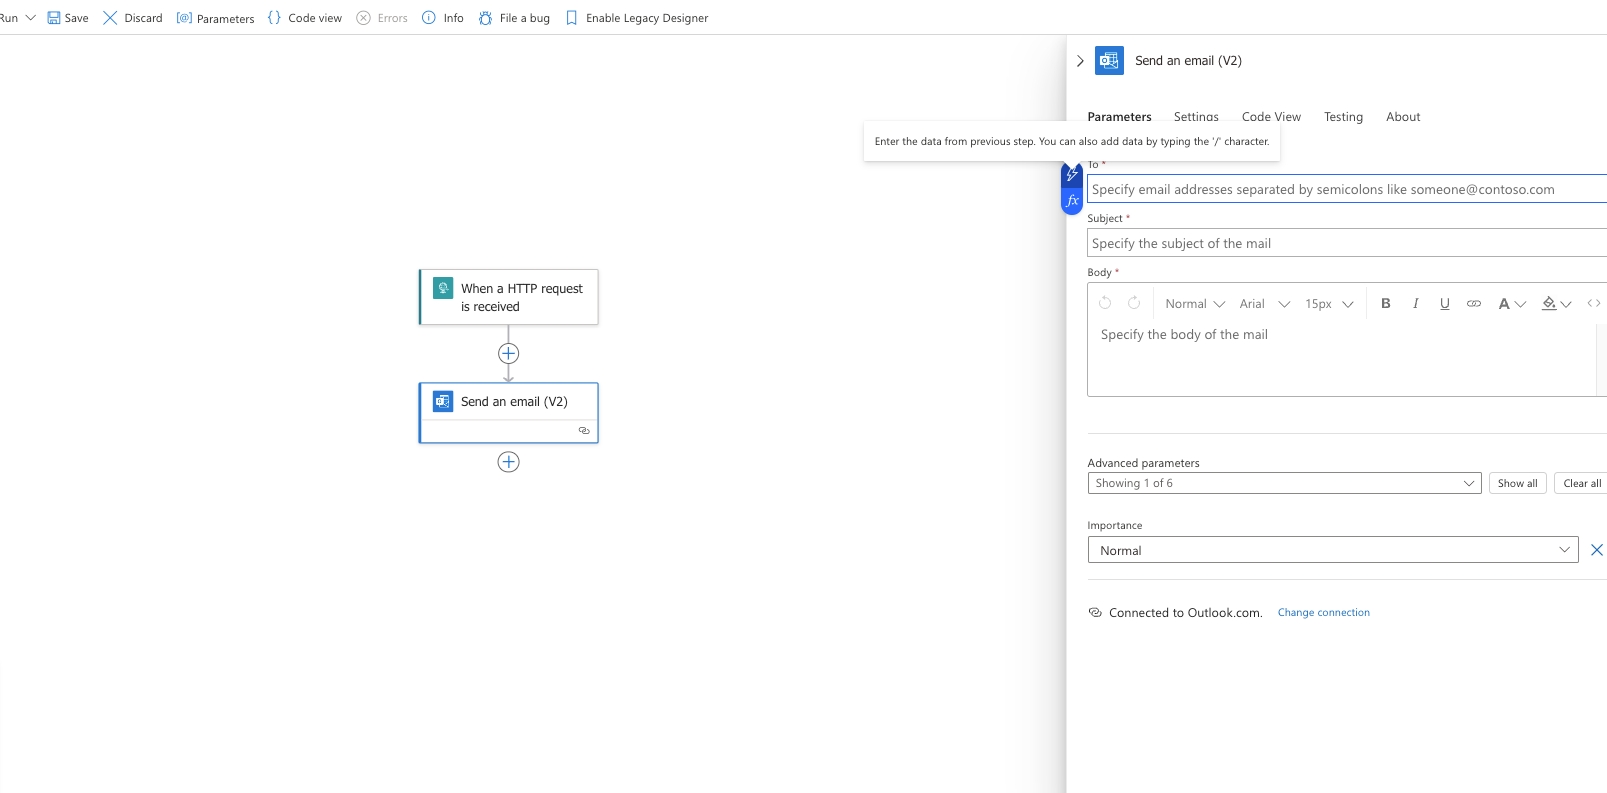
Create an outgoing webhook in Apono that will send emails to Outlook / Gmail based on Apono access requests using Azure Logic App
An Azure Logic App integration can seamlessly connect with Outlook or Gmail using their respective APIs to send Apono access requests events. By configuring triggers to initiate actions based on specified conditions, the Logic App can efficiently gather the necessary data and format it appropriately for transmission.
Utilizing Azure's secure connectivity and workflow automation capabilities, this integration ensures reliable and timely delivery of event notifications to users' Outlook or Gmail accounts, streamlining communication and enhancing productivity.
An Azure account with subscription (Create an Azure account ).
An Azure workflow Logic App of your choice (Create an Azure logic app ).
In Azure portal search for Logic App and choose the Logic App you want to use.
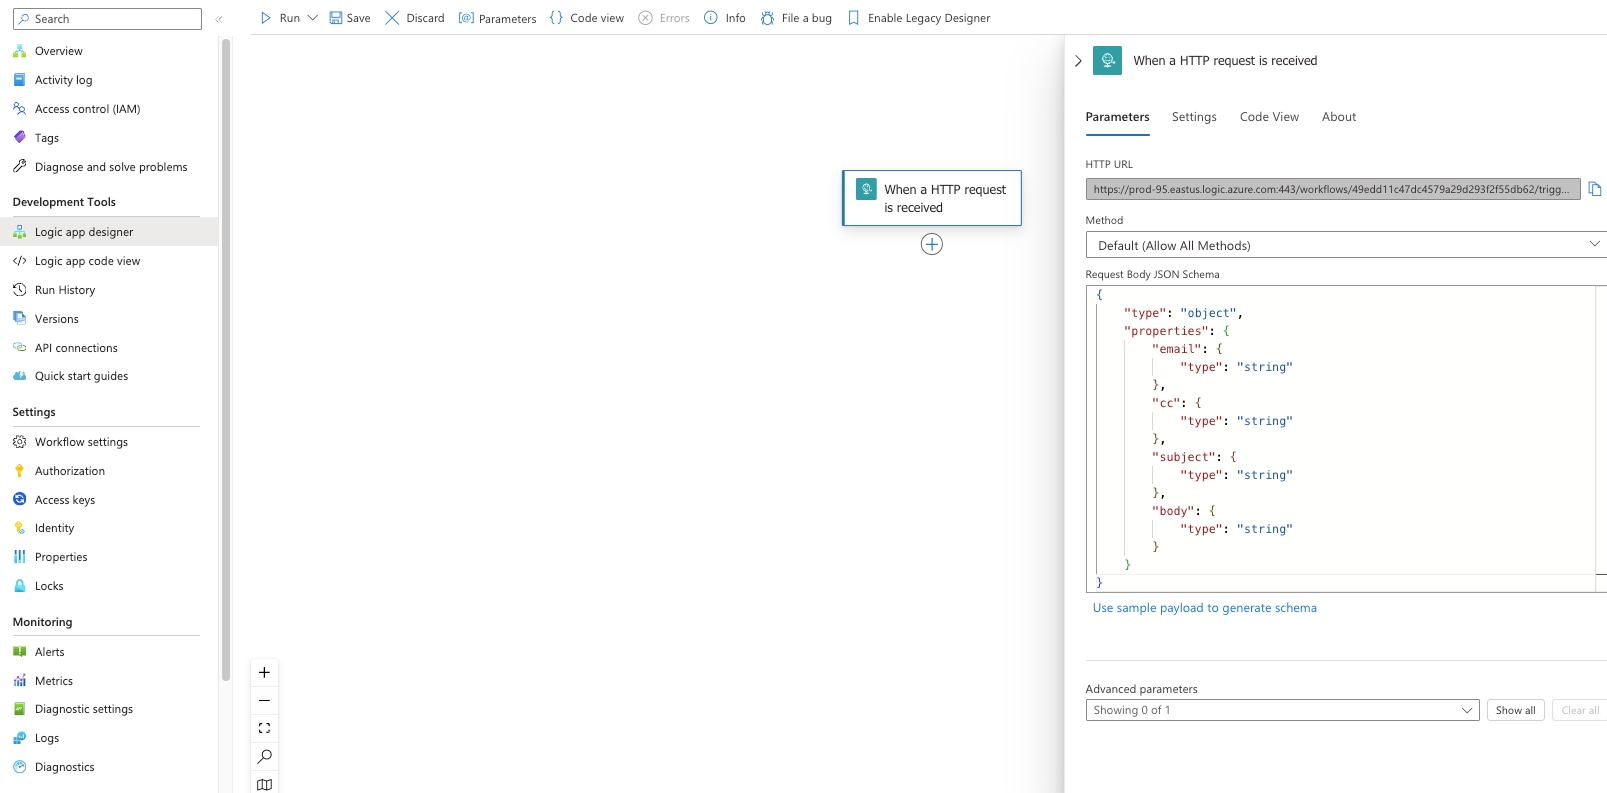
Under Logic app designer do the following:
Add the following Request Body JSON Schema and save.
As follow:
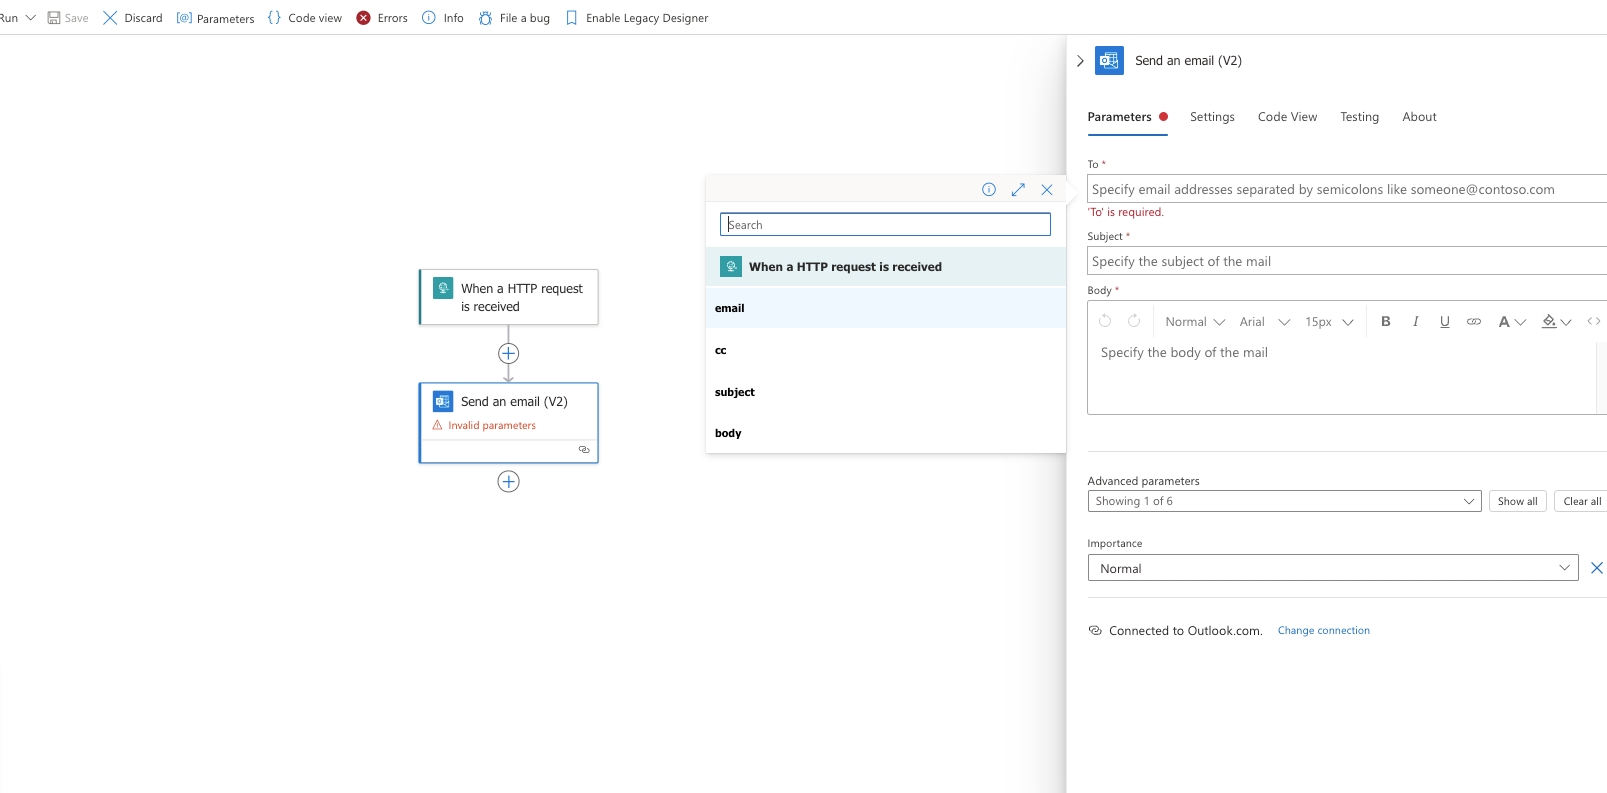
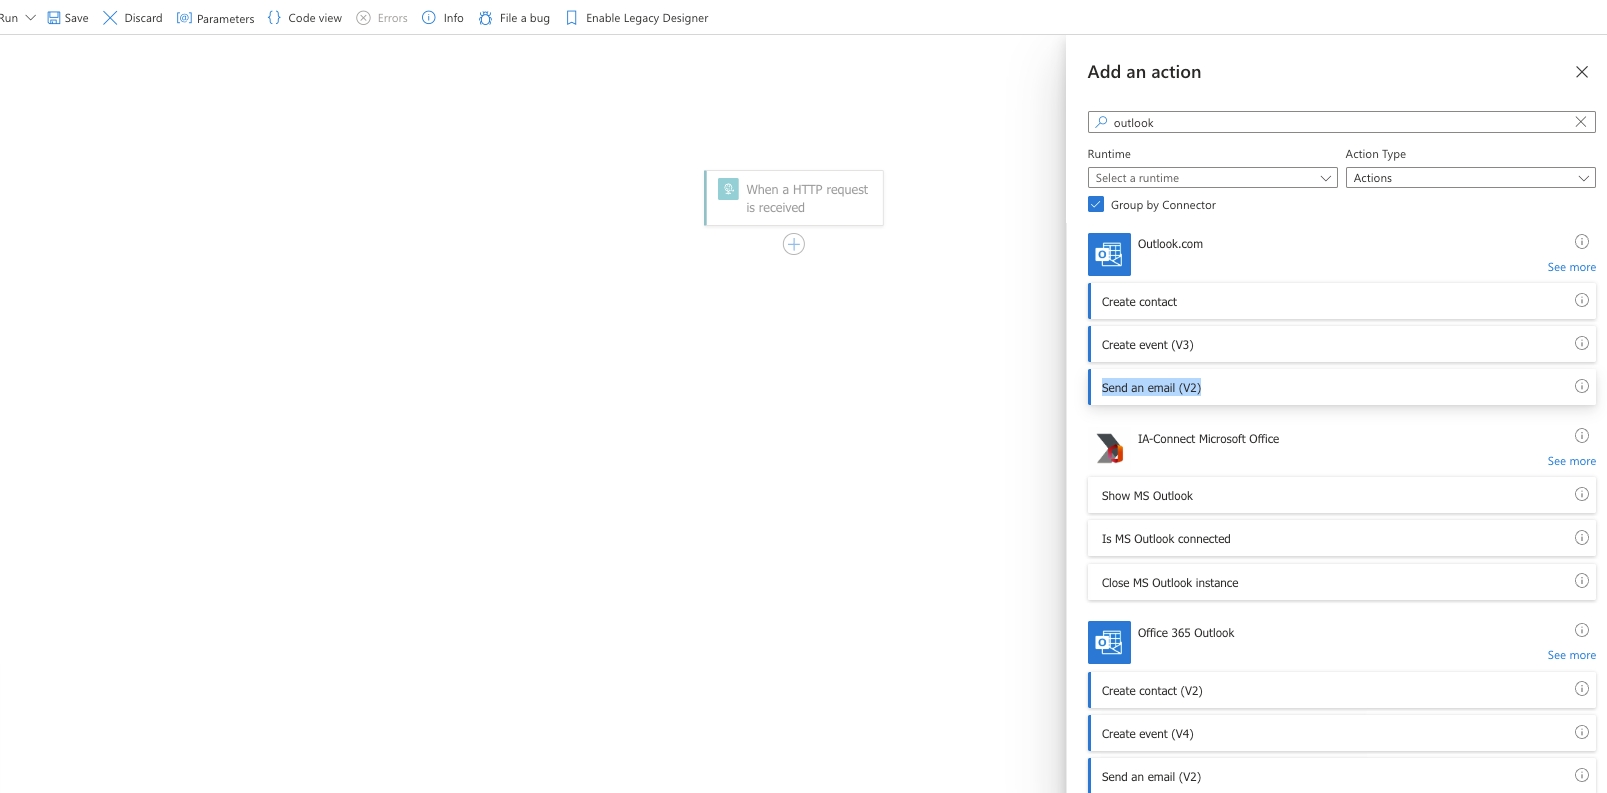
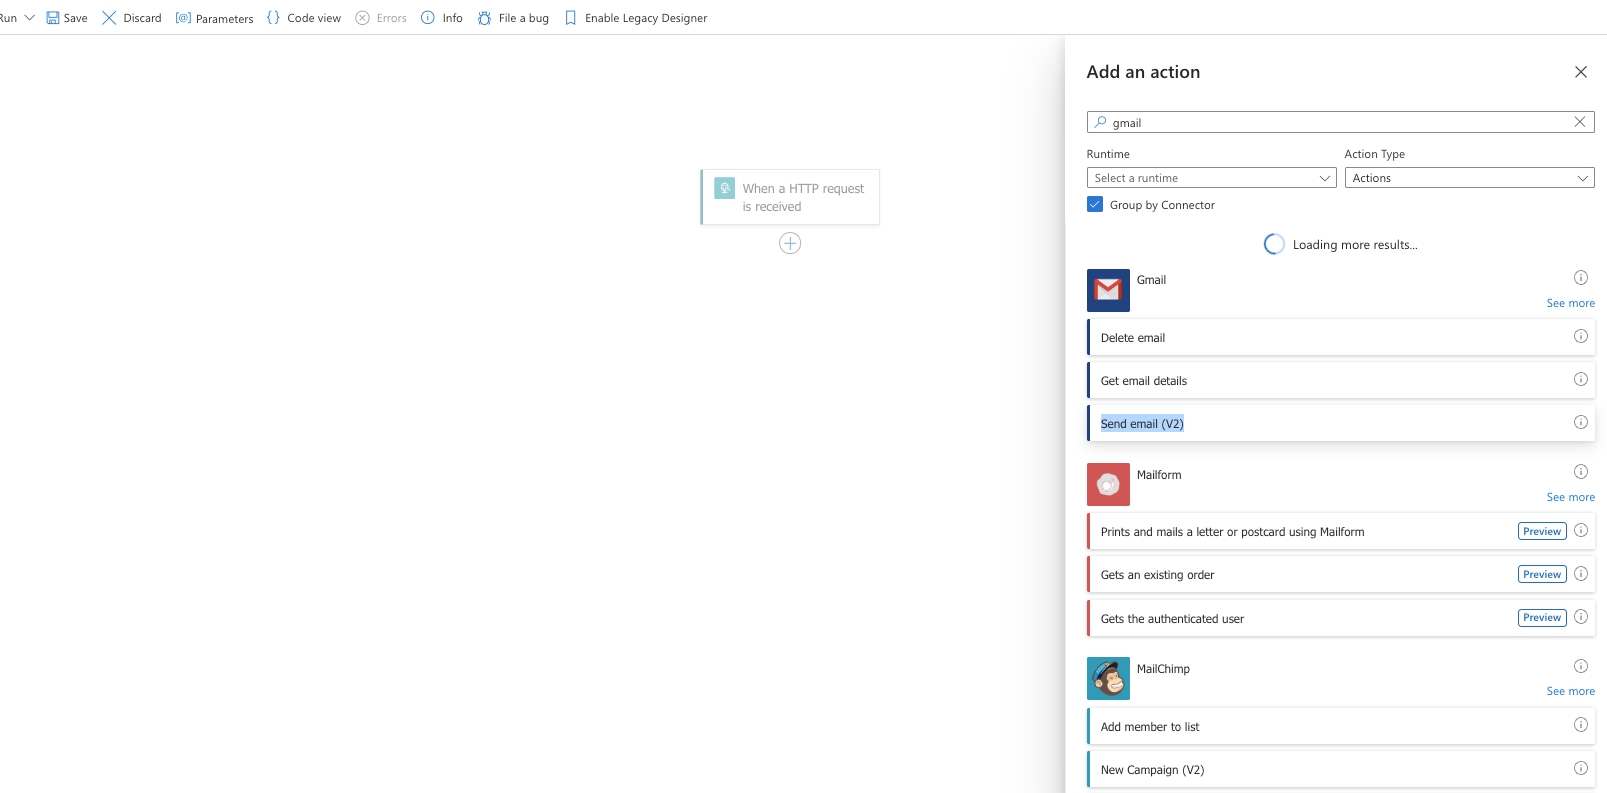
Press on the + button to add an action and search for Outlook. Under the Gmail API choose Send an email (V2), as follow:
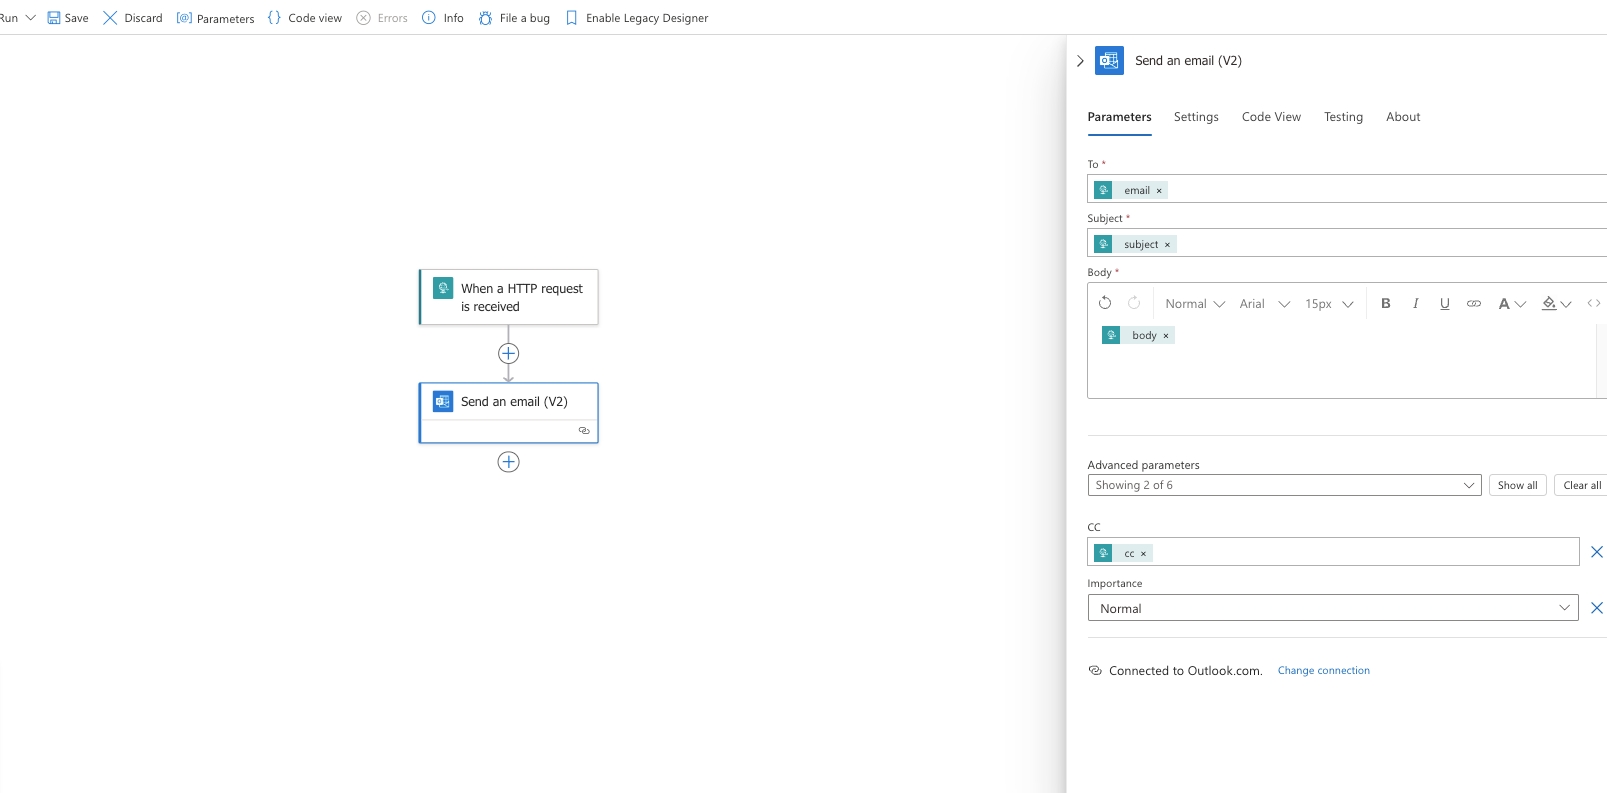
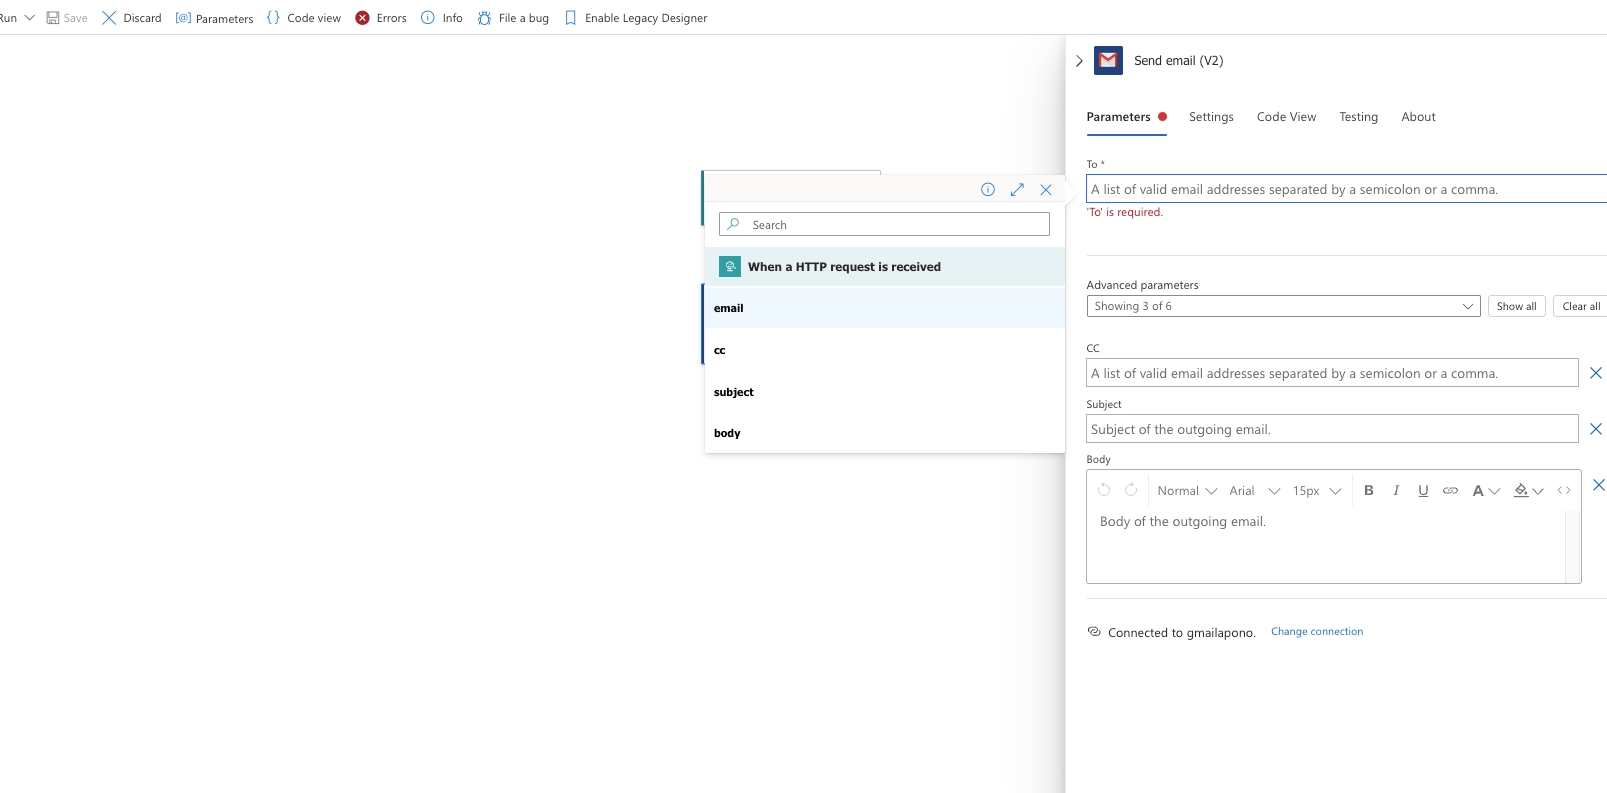
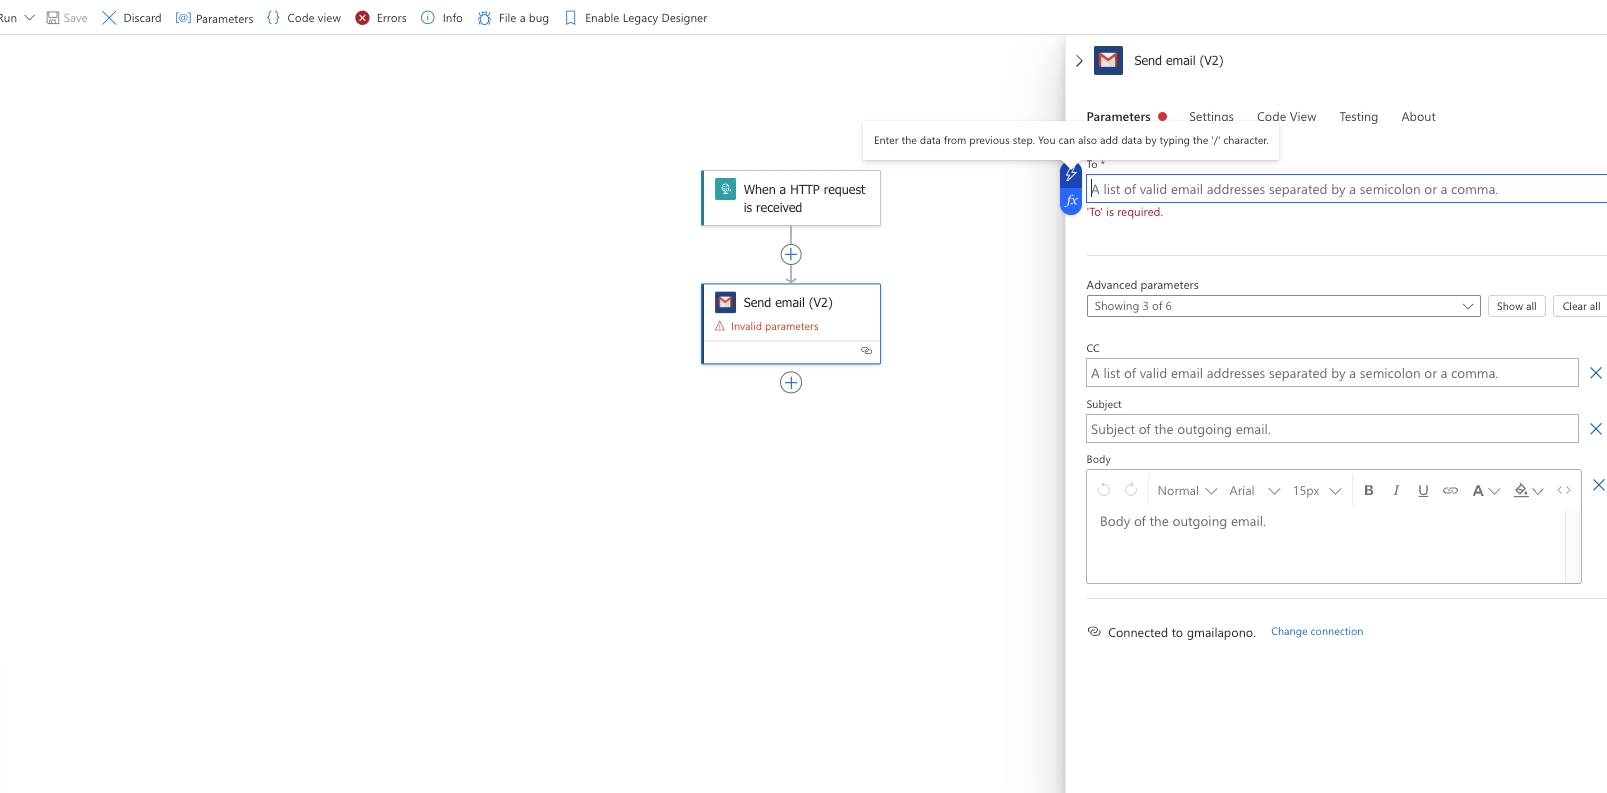
In Send an email (V2) action, configure the "When a HTTP request is received" trigger values by standing on each value input and press on the lightning icon and choose the relevant value as follow and save:
Press on the + button to add an action and search for Gmail. Under the Gmail API choose Send email (V2), as follow:
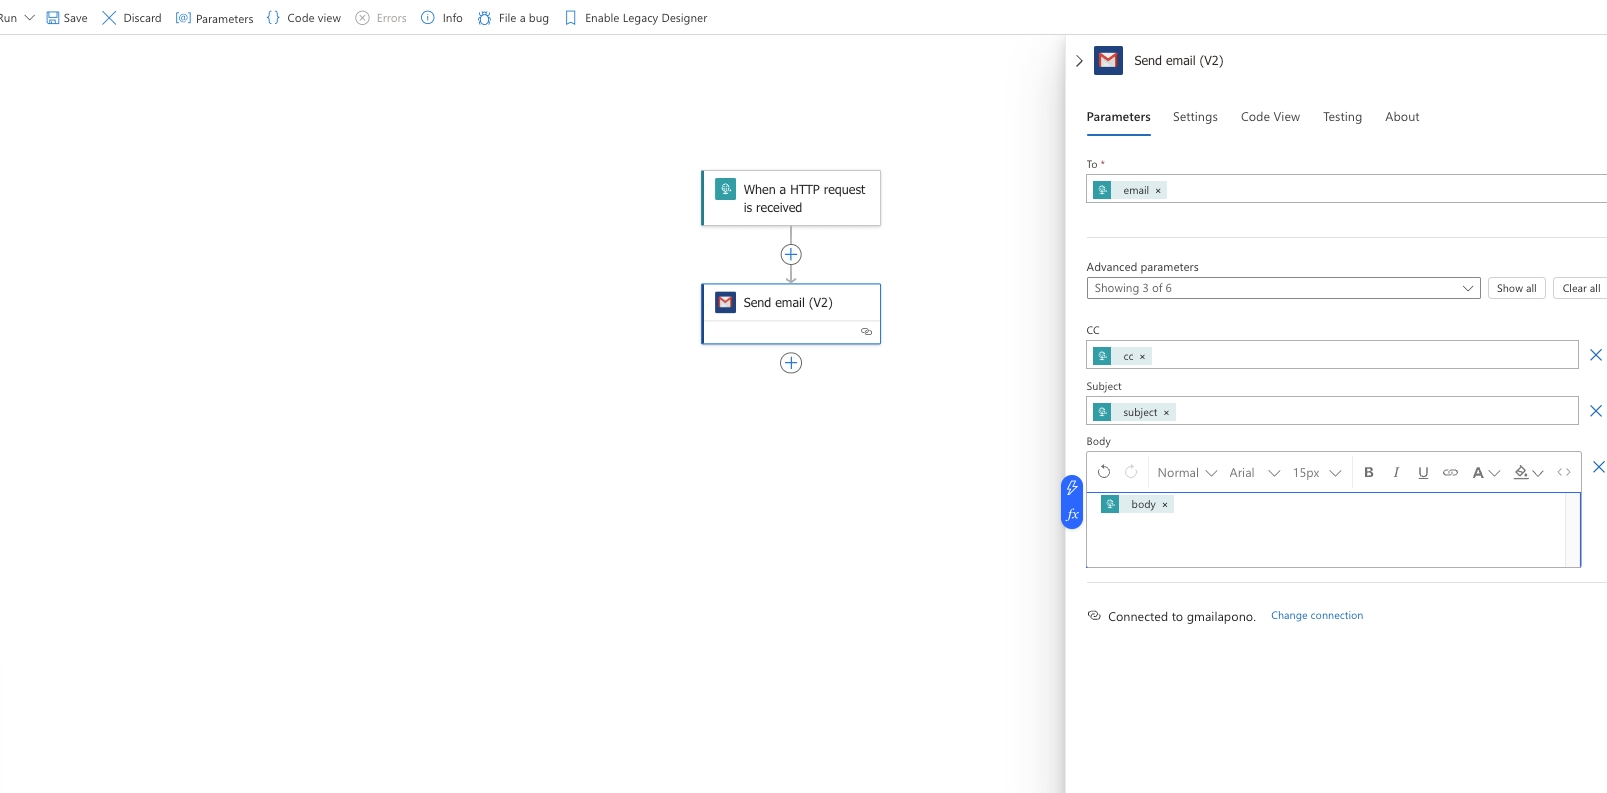
In Send email (V2) action, configure the "When a HTTP request is received" trigger values by standing on each value input and press on the lightning icon and choose the relevant value as follow and save:
Follow these steps to configure a webhook:
Click Request Webhook.
Enter a unique, alphanumeric, user-friendly Request Webhook Name for identifying this webhook.
Click the Status toggle to Active.
From the Method dropdown menu, select POST
In the URL field, enter the Workflow URL for the Logic App. This is located on the Overview page in your Azure Portal
The webhook URL must adhere to the following requirements:
Uses the HTTPS protocol
Does not specify any custom ports
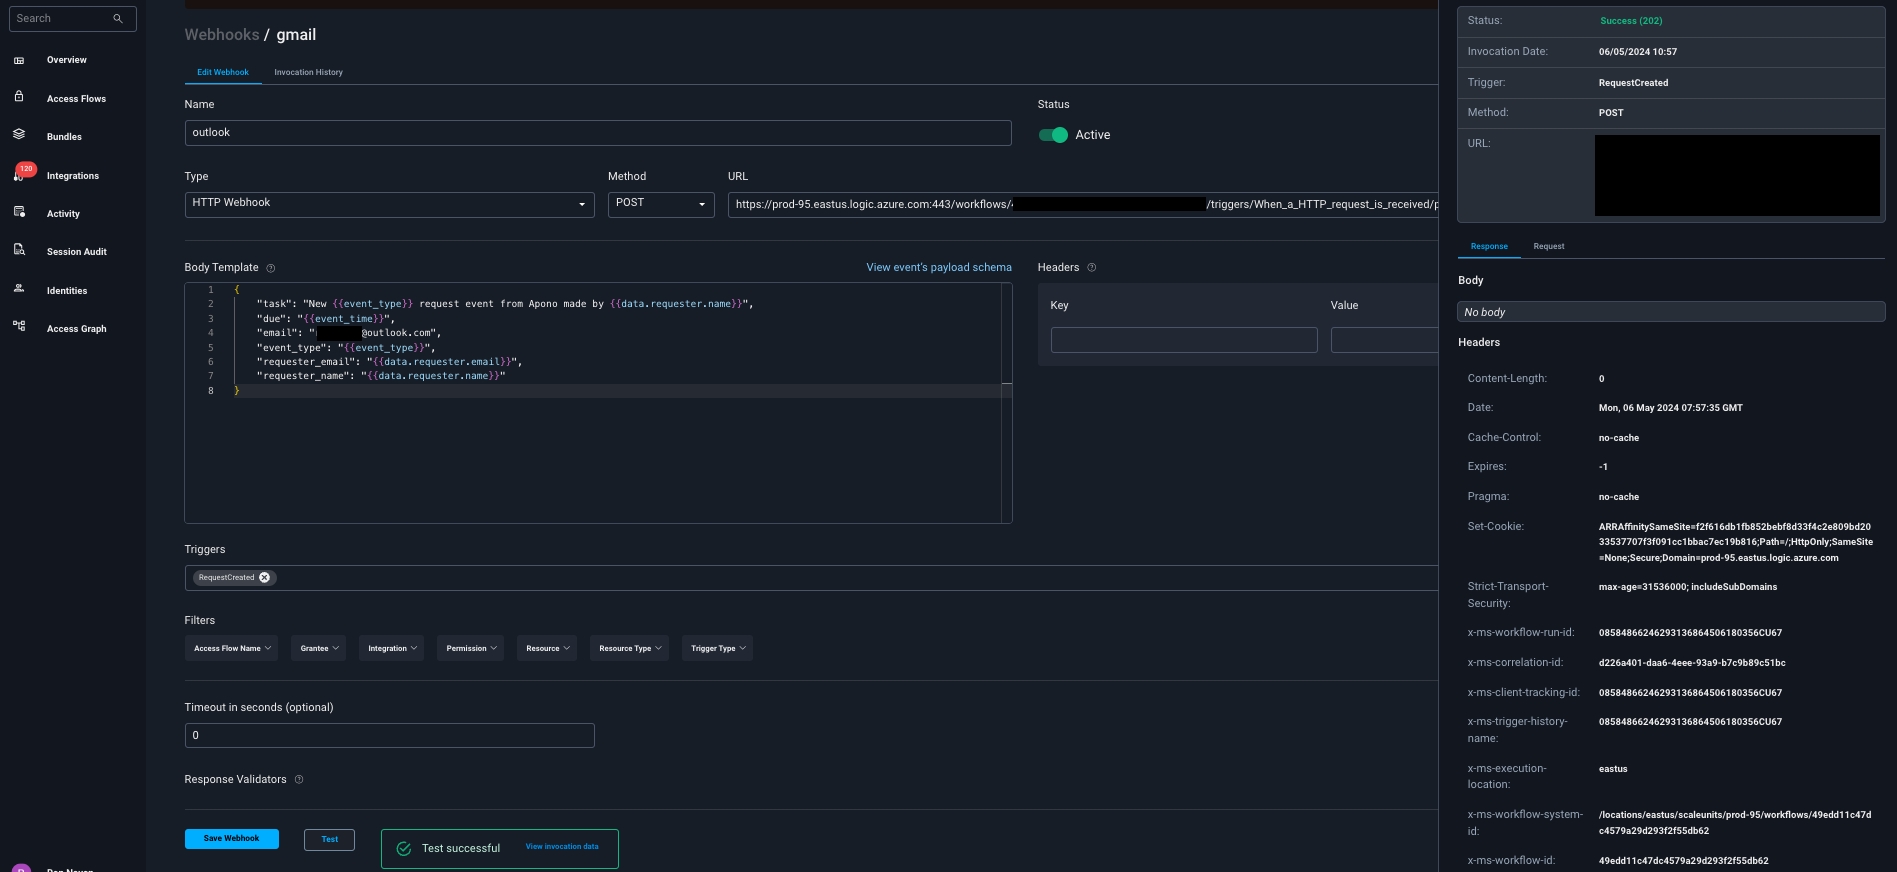
In the Body Template field, construct a JSON body for the webhook payload.
From the Triggers dropdown menu, select one or more of the following event triggers, which correspond to Apono access request statuses:
RequestCreated
RequestApproved
RequestExpired
RequestFailed
RequestGranted
RequestRejected
Under Filters, define one or several filter from the listed dropdown menus.
Filters empower admins to control the data transmitted via webhooks, minimizing the amount of data third-party tools receive and reducing unnecessary clutter.
Examples:
Send only production requests to your admins' Slack channel.
Trigger Okta workflows for events from specific integrations or resource types.
Open a ticket in Jira or ServiceNow for manually approved requests.
(Optional) In the Timeout in seconds field, enter the duration in seconds to wait before marking the request as failed.
(Optional) Define Response Validators to verify that the response from the webhook meets specified criteria:
Click + Add. A row of settings appears.
Starting with $.data., enter the Json Path of the JSON parameter.
In the Expected Values field, enter a value and press the Enter key on your keyboard.
Repeat step c to add several expected values.
Repeat steps a-d to add multiple response validators.
Click Test to generate a test event to trigger your webhook. A Test successful or Test failed response status will appear at the bottom of the page. A successful test will send mock data to the target system.
For more information about the test, click View Invocation Data. A panel opens revealing the request, response, and other relevant details.
Click Save Webhook.
The new webhook appears in the Webhooks table. Active webhooks are preceded by a green dot. Inactive webhooks are preceded by a white dot.
Apono access request logs will be sent to Outlook and Gmail based on the triggers you have selected.
Your webhook should now start sending emails using Azure Logic App to Outlook / Gmail once triggered:
Basic <USERNAME:TOKEN>
The username is the user's email and token is the personal API token required in Prerequisites 1 and 2. <USERNAME:TOKEN> must be supplied in .
Click View event's payload schema to reveal the payload schema and available data fields. You can also refer to the to read the descriptions of each data field.
Should your test fail, view these tips to .
Click View event's payload schema to reveal the payload schema and available data fields. You can also refer to the to read the descriptions of each data field.
Under Headers, use the following Key and Value to set the header. Be sure to replace <FRESHDESK_TOKEN> with a ({ base64-encoding <api_token>:X}).
Should your test fail, view these tips to .
Click View event's payload schema to reveal the payload schema and available data fields. You can also refer to the to read the descriptions of each data field.
Should your test fail, view these tips to .
Click View event's payload schema to reveal the payload schema and available data fields. You can also refer to the to read the descriptions of each data field.
Under Headers, use the following Key and Value to set the header. Be sure to replace <ZENDESK_TOKEN> with a .
Should your test fail, view these tips to .
Click View event's payload schema to reveal the payload schema and available data fields. You can also refer to the to read the descriptions of each data field.
Should your test fail, view these tips to .
On the page, click Add Webhook. The Add Webhook page appears.
Click View event's payload schema to reveal the payload schema and available data fields. You can also refer to the to read the descriptions of each data field.
Should your test fail, view these tips to .
On the page, click Add Webhook. The Add Webhook page appears.
Click View event's payload schema to reveal the payload schema and available data fields. You can also refer to the to read the descriptions of each data field.
Should your test fail, view these tips to .
Click View event's payload schema to reveal the payload schema and available data fields. You can also refer to the to read the descriptions of each data field.
For Headers, enter the following authorization headers. Replace the placeholder values with the API key and key ID that you .
Should your test fail, view these tips to .
On the page, click Add Webhook. The Add Webhook page appears.
Click View event's payload schema to reveal the payload schema and available data fields. You can also refer to the to read the descriptions of each data field.
Should your test fail, view these tips to .
On the page, click Add Webhook. The Add Webhook page appears.
Click View event's payload schema to reveal the payload schema and available data fields. You can also refer to the to read the descriptions of each data field.
Should your test fail, view these tips to .
On the page, click Add Webhook. The Add Webhook page appears.
Click View event's payload schema to reveal the payload schema and available data fields. You can also refer to the to read the descriptions of each data field.
Should your test fail, view these tips to .
Authorization
Basic <BASE-64-API-KEY>
Authorization
Basic <FRESHDESK_TOKEN>
Authorization
Bearer <SERVICENOW_TOKEN>
Authorization
Bearer <ZENDESK_TOKEN>
Authorization
authtoken <API-KEY>
DD-API-KEY
<API KEY>
DD-APPLICATION-KEY
<KEY ID>
Authorization
Bearer <INCOMING_WEBHOOK_TOKEN>
Authorization
Bearer <API_KEY>
Freshdesk API Token
Authentication credential used when making requests to the Freshdesk API Follow the steps to generate an API token:
Log in to your Freshdesk account.
Click your profile picture > Profile settings
Click View API key.
Freshdesk API URL
Route for creating a ticket in your Freshdesk instance
Example: https://<SUBDOMAIN>.freshdesk.com/api/v2/tickets
ServiceNow Account
Account with the Administrator role
ServiceNow Application Registration
Registration that enables Apono to use OAuth authorization
Be sure to copy the client_id and client_secret. You will use these values to generate the ServiceNow API token.
ServiceNow Information
Information for the ServiceNow instance:
Instance ID
Username
Password
Follow these steps to retrieve the ServiceName information:
On the ServiceNow Developers home page, click your account icon > Manage instance password. The Manage instance password popup window appears.
Copy the Instance name, Username, and Password.
ServiceNow API token
Credential generated with a username and a password and used when making requests to the ServiceNow API.
Zendesk API Token
Authentication credential used when making requests to the Zendesk API Follow the steps to generate an API token:
Log in to Zendesk Admin Center.
Click Apps and Integrations > Zendesk API > Add API Token.
Zendesk API URL
Route for creating a ticket in your Zendesk instance
Example: https://<YOURDOMAIN>.zendesk.com/api/v2/tickets
Datadog API key
Key for accessing the Datadog REST API
Create an outgoing webhook to create custom event on Cortex triggered by Apono access request events
Cortex makes it easy for engineering organizations to gain visibility into their services and deliver high quality software.
This guide shows you how to configure and test outbound webhooks for Cortex.
Cortex API key and assigned User role to it. Copy the API key to use it later.
Cortex entity. Use Create an entity manually for Apono access request events.
Follow these steps to configure a webhook:
On the Webhooks page, click Add Webhook. The Add Webhook page appears.
Click Request Webhook.
Enter a unique, alphanumeric, user-friendly Request Webhook Name for identifying this webhook.
Click the Status toggle to Active.
From the Method dropdown menu, select POST.
For the webhook URL, enter https://api.getcortexapp.com/api/v1/catalog/<entity-tagOrId>/custom-events.
In the Body Template field, construct a JSON body for the webhook payload.
Click View event's payload schema to reveal the payload schema and available data fields. You can also refer to the Webhook Payload Schema Reference to read the descriptions of each data field.
For Headers, use the following Key and Value to set the authorization.
Authorization
Bearer <BASE64-API-KEY>
From the Triggers dropdown menu, select one or more of the following event triggers, which correspond to Apono access request statuses:
RequestCreated
RequestApproved
RequestExpired
RequestFailed
RequestGranted
RequestRejected
Under Filters, define one or several filter from the listed dropdown menus.
Filters empower admins to control the data transmitted via webhooks, minimizing the amount of data third-party tools receive and reducing unnecessary clutter.
Examples:
Send only production requests to your admins' Slack channel.
Trigger Okta workflows for events from specific integrations or resource types.
Open a ticket in Jira or ServiceNow for manually approved requests.
(Optional) In the Timeout in seconds field, enter the duration in seconds to wait before marking the request as failed.
(Optional) Define Response Validators to verify that the response from the webhook meets specified criteria:
Click + Add. A row of settings appears.
Starting with $.data., enter the Json Path of the JSON parameter.
In the Expected Values field, enter a value and press the Enter key on your keyboard.
Repeat step c to add several expected values.
Repeat steps a-d to add multiple response validators.
Click Test to generate a test event to trigger your webhook. A Test successful or Test failed response status will appear at the bottom of the page. A successful test will send mock data to the target system.
For more information about the test, click View Invocation Data. A panel opens revealing the request, response, and other relevant details.
Should your test fail, view these tips to troubleshoot your webhook.
Click Save Webhook.
The new webhook appears in the Webhooks table. Active webhooks are preceded by a green dot. Inactive webhooks are preceded by a white dot.
Apono access request custom event will be created on Cortex Apono entity based on the triggers you have selected.
Create an outgoing webhook to create incidents on Logpoint triggered by Apono access request events
Logpoint collects real-time data from multiple sources and centralizes it for comprehensive analysis. You can search, analyze, generate reports, detect vulnerabilities, and configure alerts to enhance threat detection capabilities. You can also automate threat response based on specific security incidents.
Logpoint API requires two request parameters:
username, which includes a Logpoint username. Your access control for using the APIs is the same as your user roles in the system
secret_key, which is the access key to uniquely identify you as an authorized user.
\
Follow these steps to configure a webhook:
On the Webhooks page, click Add Webhook. The Add Webhook page appears.
Click Request Webhook.
Enter a unique, alphanumeric, user-friendly Request Webhook Name for identifying this webhook.
Click the Status toggle to Active.
From the Method dropdown menu, select POST.
For the webhook URL, enter https://Logpoint-IP/reopen_incident.
In the Body Template field, construct a JSON body for the webhook payload.
Click View event's payload schema to reveal the payload schema and available data fields. You can also refer to the Webhook Payload Schema Reference to read the descriptions of each data field.
From the Triggers dropdown menu, select one or more of the following event triggers, which correspond to Apono access request statuses:
RequestCreated
RequestApproved
RequestExpired
RequestFailed
RequestGranted
RequestRejected
Under Filters, define one or several filter from the listed dropdown menus.
Filters empower admins to control the data transmitted via webhooks, minimizing the amount of data third-party tools receive and reducing unnecessary clutter.
Examples:
Send only production requests to your admins' Slack channel.
Trigger Okta workflows for events from specific integrations or resource types.
Open a ticket in Jira or ServiceNow for manually approved requests.
(Optional) In the Timeout in seconds field, enter the duration in seconds to wait before marking the request as failed.
(Optional) Define Response Validators to verify that the response from the webhook meets specified criteria:
Click + Add. A row of settings appears.
Starting with $.data., enter the Json Path of the JSON parameter.
In the Expected Values field, enter a value and press the Enter key on your keyboard.
Repeat step c to add several expected values.
Repeat steps a-d to add multiple response validators.
Click Test to generate a test event to trigger your webhook. A Test successful or Test failed response status will appear at the bottom of the page. A successful test will send mock data to the target system.
For more information about the test, click View Invocation Data. A panel opens revealing the request, response, and other relevant details.
Should your test fail, view these tips to troubleshoot your webhook.
Click Save Webhook.
The new webhook appears in the Webhooks table. Active webhooks are preceded by a green dot. Inactive webhooks are preceded by a white dot.
Apono access request incident will be created on Logpoint based on the triggers you have selected.
Create an outgoing webhook to send events to Splunk triggered by Apono access request events
Splunk is software used to search and analyze machine data. This machine data can come from web applications, sensors, devices or any data created by user. It serves the needs of IT infrastructure by analyzing the logs generated in various processes.
Splunk authentication token. Copy the token to use it later.\
Follow these steps to configure a webhook:
On the Webhooks page, click Add Webhook. The Add Webhook page appears.
Click Request Webhook.
Enter a unique, alphanumeric, user-friendly Request Webhook Name for identifying this webhook.
Click the Status toggle to Active.
From the Method dropdown menu, select POST.
For the webhook URL, enter https://<host>:<port>/services/collector.
In the Body Template field, construct a JSON body for the webhook payload.
Click View event's payload schema to reveal the payload schema and available data fields. You can also refer to the Webhook Payload Schema Reference to read the descriptions of each data field.
For Headers, use the following Key and Value to set the authorization.
Authorization
Bearer <TOKEN>
From the Triggers dropdown menu, select one or more of the following event triggers, which correspond to Apono access request statuses:
RequestCreated
RequestApproved
RequestExpired
RequestFailed
RequestGranted
RequestRejected
Under Filters, define one or several filter from the listed dropdown menus.
Filters empower admins to control the data transmitted via webhooks, minimizing the amount of data third-party tools receive and reducing unnecessary clutter.
Examples:
Send only production requests to your admins' Slack channel.
Trigger Okta workflows for events from specific integrations or resource types.
Open a ticket in Jira or ServiceNow for manually approved requests.
(Optional) In the Timeout in seconds field, enter the duration in seconds to wait before marking the request as failed.
(Optional) Define Response Validators to verify that the response from the webhook meets specified criteria:
Click + Add. A row of settings appears.
Starting with $.data., enter the Json Path of the JSON parameter.
In the Expected Values field, enter a value and press the Enter key on your keyboard.
Repeat step c to add several expected values.
Repeat steps a-d to add multiple response validators.
Click Test to generate a test event to trigger your webhook. A Test successful or Test failed response status will appear at the bottom of the page. A successful test will send mock data to the target system.
For more information about the test, click View Invocation Data. A panel opens revealing the request, response, and other relevant details.
Should your test fail, view these tips to troubleshoot your webhook.
Click Save Webhook.
The new webhook appears in the Webhooks table. Active webhooks are preceded by a green dot. Inactive webhooks are preceded by a white dot.
Apono access request events will be sent Splunk based on the triggers you have selected.
Create an outgoing webhook to create incidents on Sentinel triggered by Apono access request events
Microsoft Sentinel is a scalable, cloud-native security information and event management (SIEM) that delivers an intelligent and comprehensive solution for SIEM and security orchestration, automation, and response (SOAR). Microsoft Sentinel provides cyberthreat detection, investigation, response, and proactive hunting, with a bird's-eye view across your enterprise.
Configure logs ingestion API in Azure Monitor to send Apono's access request events data to a Log Analytics workspace with a REST API by using the following guide.
You can use the following sample JSON as the table schema file on the parse and filter sample data step:
Azure JWT token.
Get your JWT token using Postman:
Set up the Token Request:
Method: POST
URL: https://login.microsoftonline.com/<TenantId>/oauth2/v2.0/token
Replace TenantId with your Azure AD Tenant ID.
Add the Body parameters:
Go to the Body tab and select x-www-form-urlencoded.
Add the following key-value pairs:
grant_type: client_credentials
client_id: Your application's Client ID.
client_secret: Your application's Client Secret.
scope: https://monitor.azure.com/.default
The scope should target the Azure Monitor API, represented by https://monitor.azure.com/.default.
Send the Request:
Click Send and copy the access_token value. If the credentials are correct, you will receive a response similar to this:
Microsoft incident creation rule in your Sentinel Analytics.
Microsoft incident creation rule example:
Under General set the following:
Severity: Information
MITRE ATT&CK: T1650 - Acquire Access
Under Set rule logic set the following:
Rule query: <Log-Analytics-table-name>
Follow these steps to configure a webhook:
On the Webhooks page, click Add Webhook. The Add Webhook page appears.
Click Request Webhook.
Enter a unique, alphanumeric, user-friendly Request Webhook Name for identifying this webhook.
Click the Status toggle to Active.
From the Method dropdown menu, select POST.
For the webhook URL, enter <Data Collection Endpoint URI>/dataCollectionRules/<DCR Immutable ID>/streams/<Stream Name>?api-version=2023-01-01.
In the Body Template field, construct a JSON body for the webhook payload.
Click View event's payload schema to reveal the payload schema and available data fields. You can also refer to the Webhook Payload Schema Reference to read the descriptions of each data field.
For Headers, use the following Key and Value to set the authorization.
Authorization
Bearer <JWT-TOKEN>
From the Triggers dropdown menu, select one or more of the following event triggers, which correspond to Apono access request statuses:
RequestCreated
RequestApproved
RequestExpired
RequestFailed
RequestGranted
RequestRejected
Under Filters, define one or several filter from the listed dropdown menus.
Filters empower admins to control the data transmitted via webhooks, minimizing the amount of data third-party tools receive and reducing unnecessary clutter.
Examples:
Send only production requests to your admins' Slack channel.
Trigger Okta workflows for events from specific integrations or resource types.
Open a ticket in Jira or ServiceNow for manually approved requests.
(Optional) In the Timeout in seconds field, enter the duration in seconds to wait before marking the request as failed.
(Optional) Define Response Validators to verify that the response from the webhook meets specified criteria:
Click + Add. A row of settings appears.
Starting with $.data., enter the Json Path of the JSON parameter.
In the Expected Values field, enter a value and press the Enter key on your keyboard.
Repeat step c to add several expected values.
Repeat steps a-d to add multiple response validators.
Click Test to generate a test event to trigger your webhook. A Test successful or Test failed response status will appear at the bottom of the page. A successful test will send mock data to the target system.
For more information about the test, click View Invocation Data. A panel opens revealing the request, response, and other relevant details.
Should your test fail, view these tips to troubleshoot your webhook.
Click Save Webhook.
The new webhook appears in the Webhooks table. Active webhooks are preceded by a green dot. Inactive webhooks are preceded by a white dot.
Apono access request incident will be created on Sentinel based on the triggers you have selected.
Your webhook should now start creating new incidents on Sentinel once triggered:
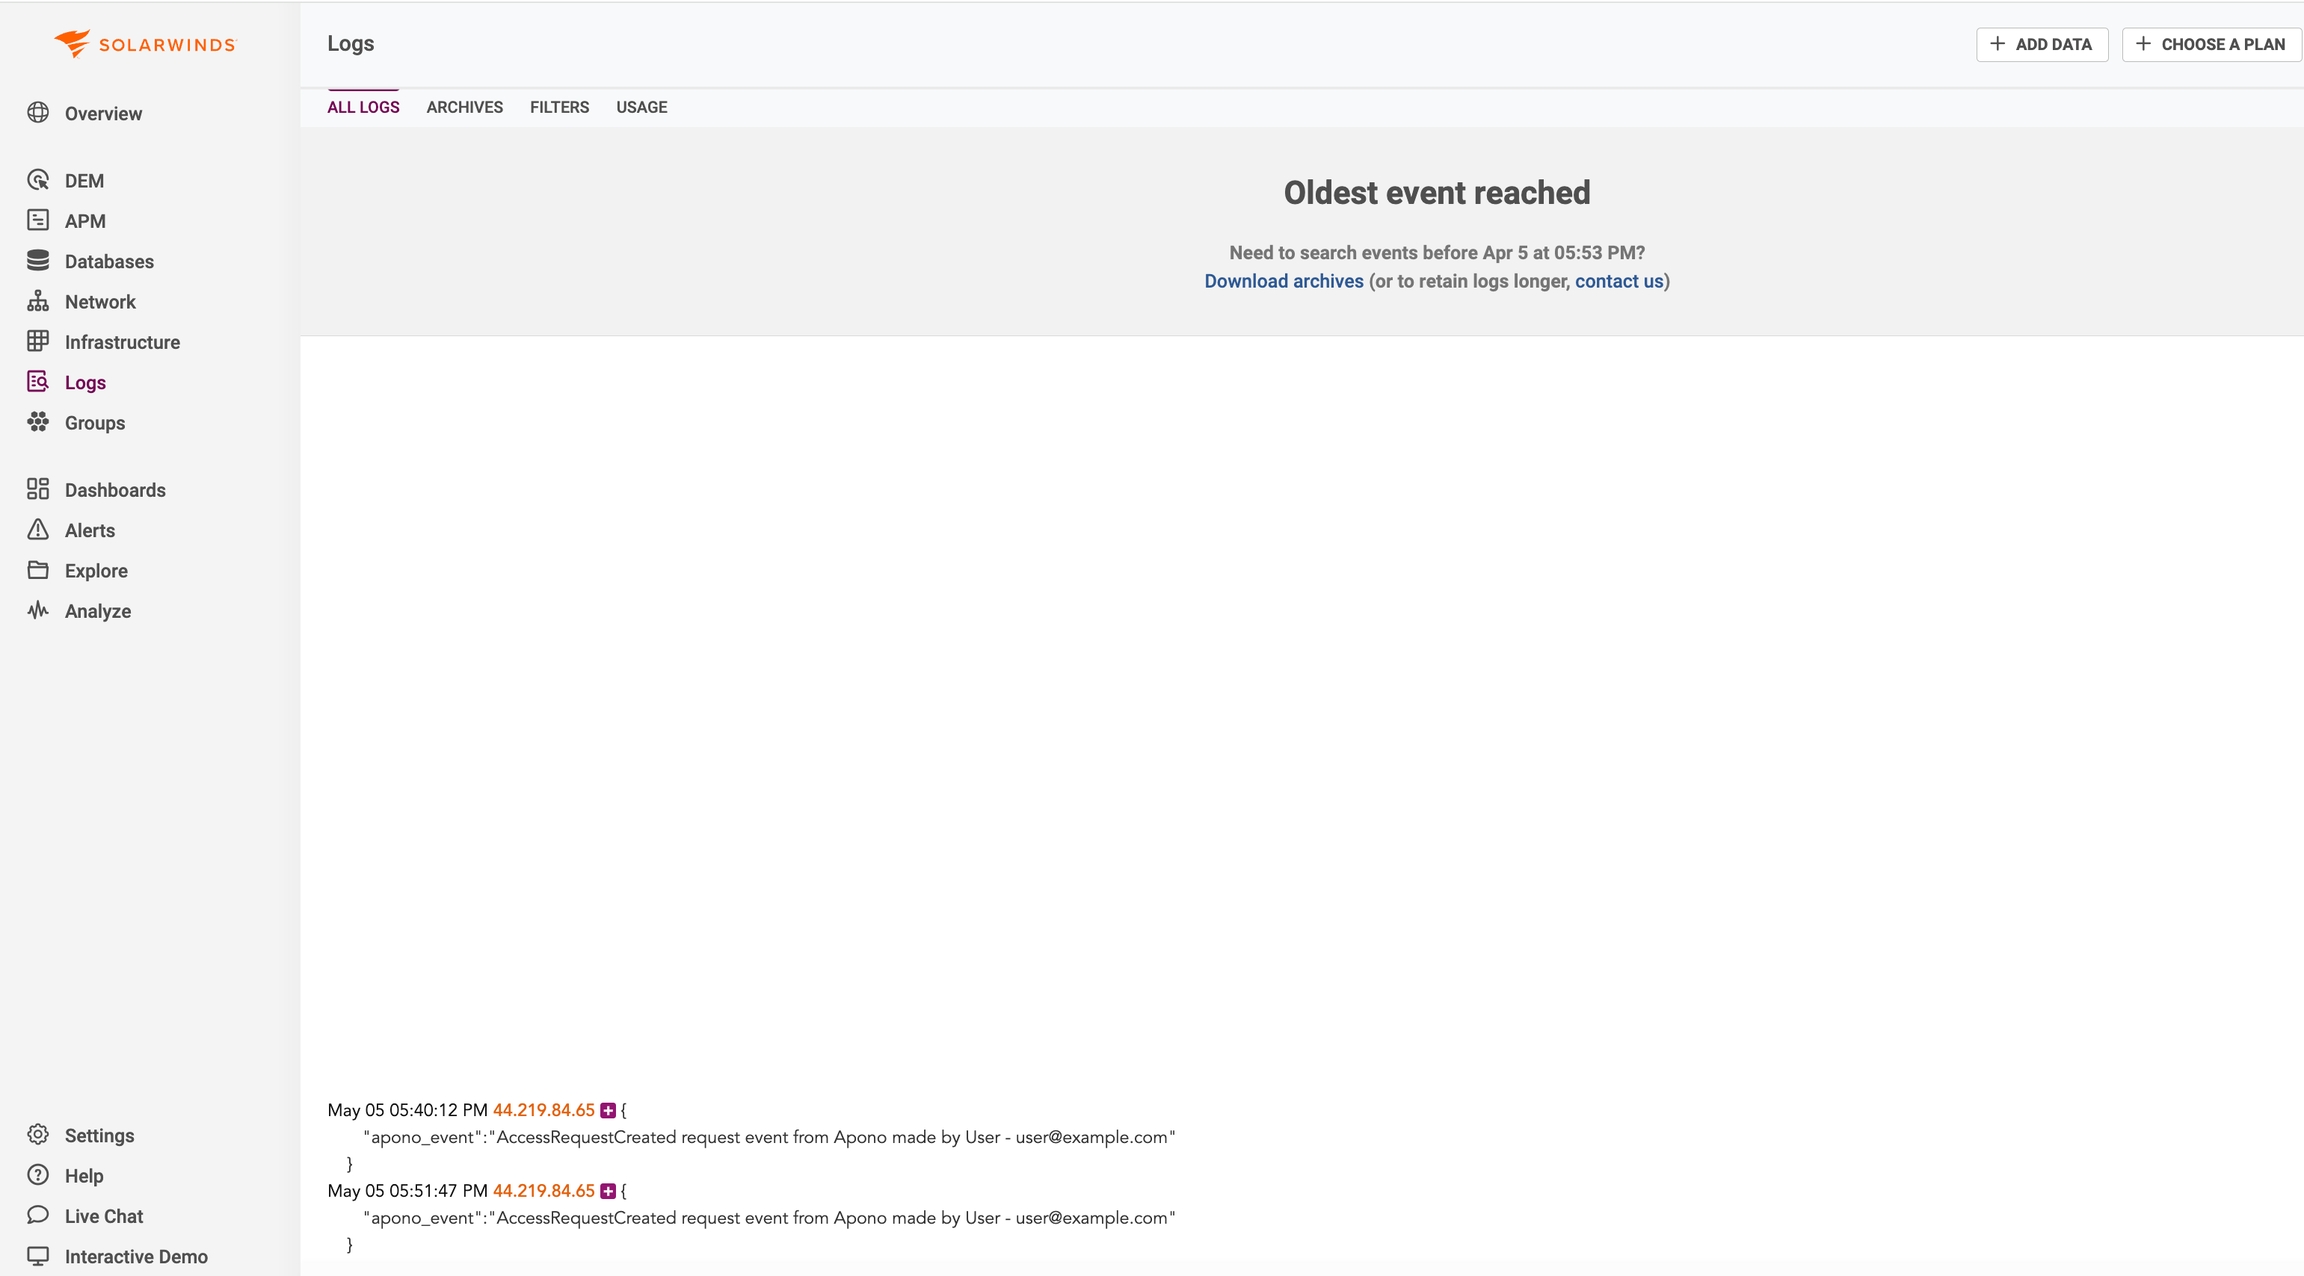
Send logs to SolarWinds triggered by Apono access requests events
SolarWinds' flagship product, Orion platform, is a comprehensive network management solution offering real-time monitoring and performance optimization for IT infrastructures. It enables IT professionals to quickly identify and resolve issues, optimize resource utilization, and ensure smooth network operation.
SolarWinds Account
Account with the Administrator role
Set up SolarWinds over HTTPS data source
Follow these steps to set up SolarWinds over HTTPS data source:
In SolarWinds Observability, click Add Data at the top.
In the Add Data dialog, click Logs.
Click Manual Configuration.
Create or select an API ingestion token to use when sending your logs by doing either of the following:
Select Generate New Token and enter an Ingestion Token Name, and then click Next.
Select Use Existing Token and select an ingestion token from the list, and then click Next.
Select HTTPS and click Next.
Copy the Endpoint and Token.
Follow these steps to configure a webhook:
On the Webhooks page, click Add Webhook. The Add Webhook page appears.
Click Request Webhook.
Enter a unique, alphanumeric, user-friendly Request Webhook Name for identifying this webhook.
Click the Status toggle to Active.
From the Method dropdown menu, select POST.
In the URL field, enter the data source endpoint.
The webhook URL must adhere to the following requirements:
Uses the HTTPS protocol
Does not specify any custom ports
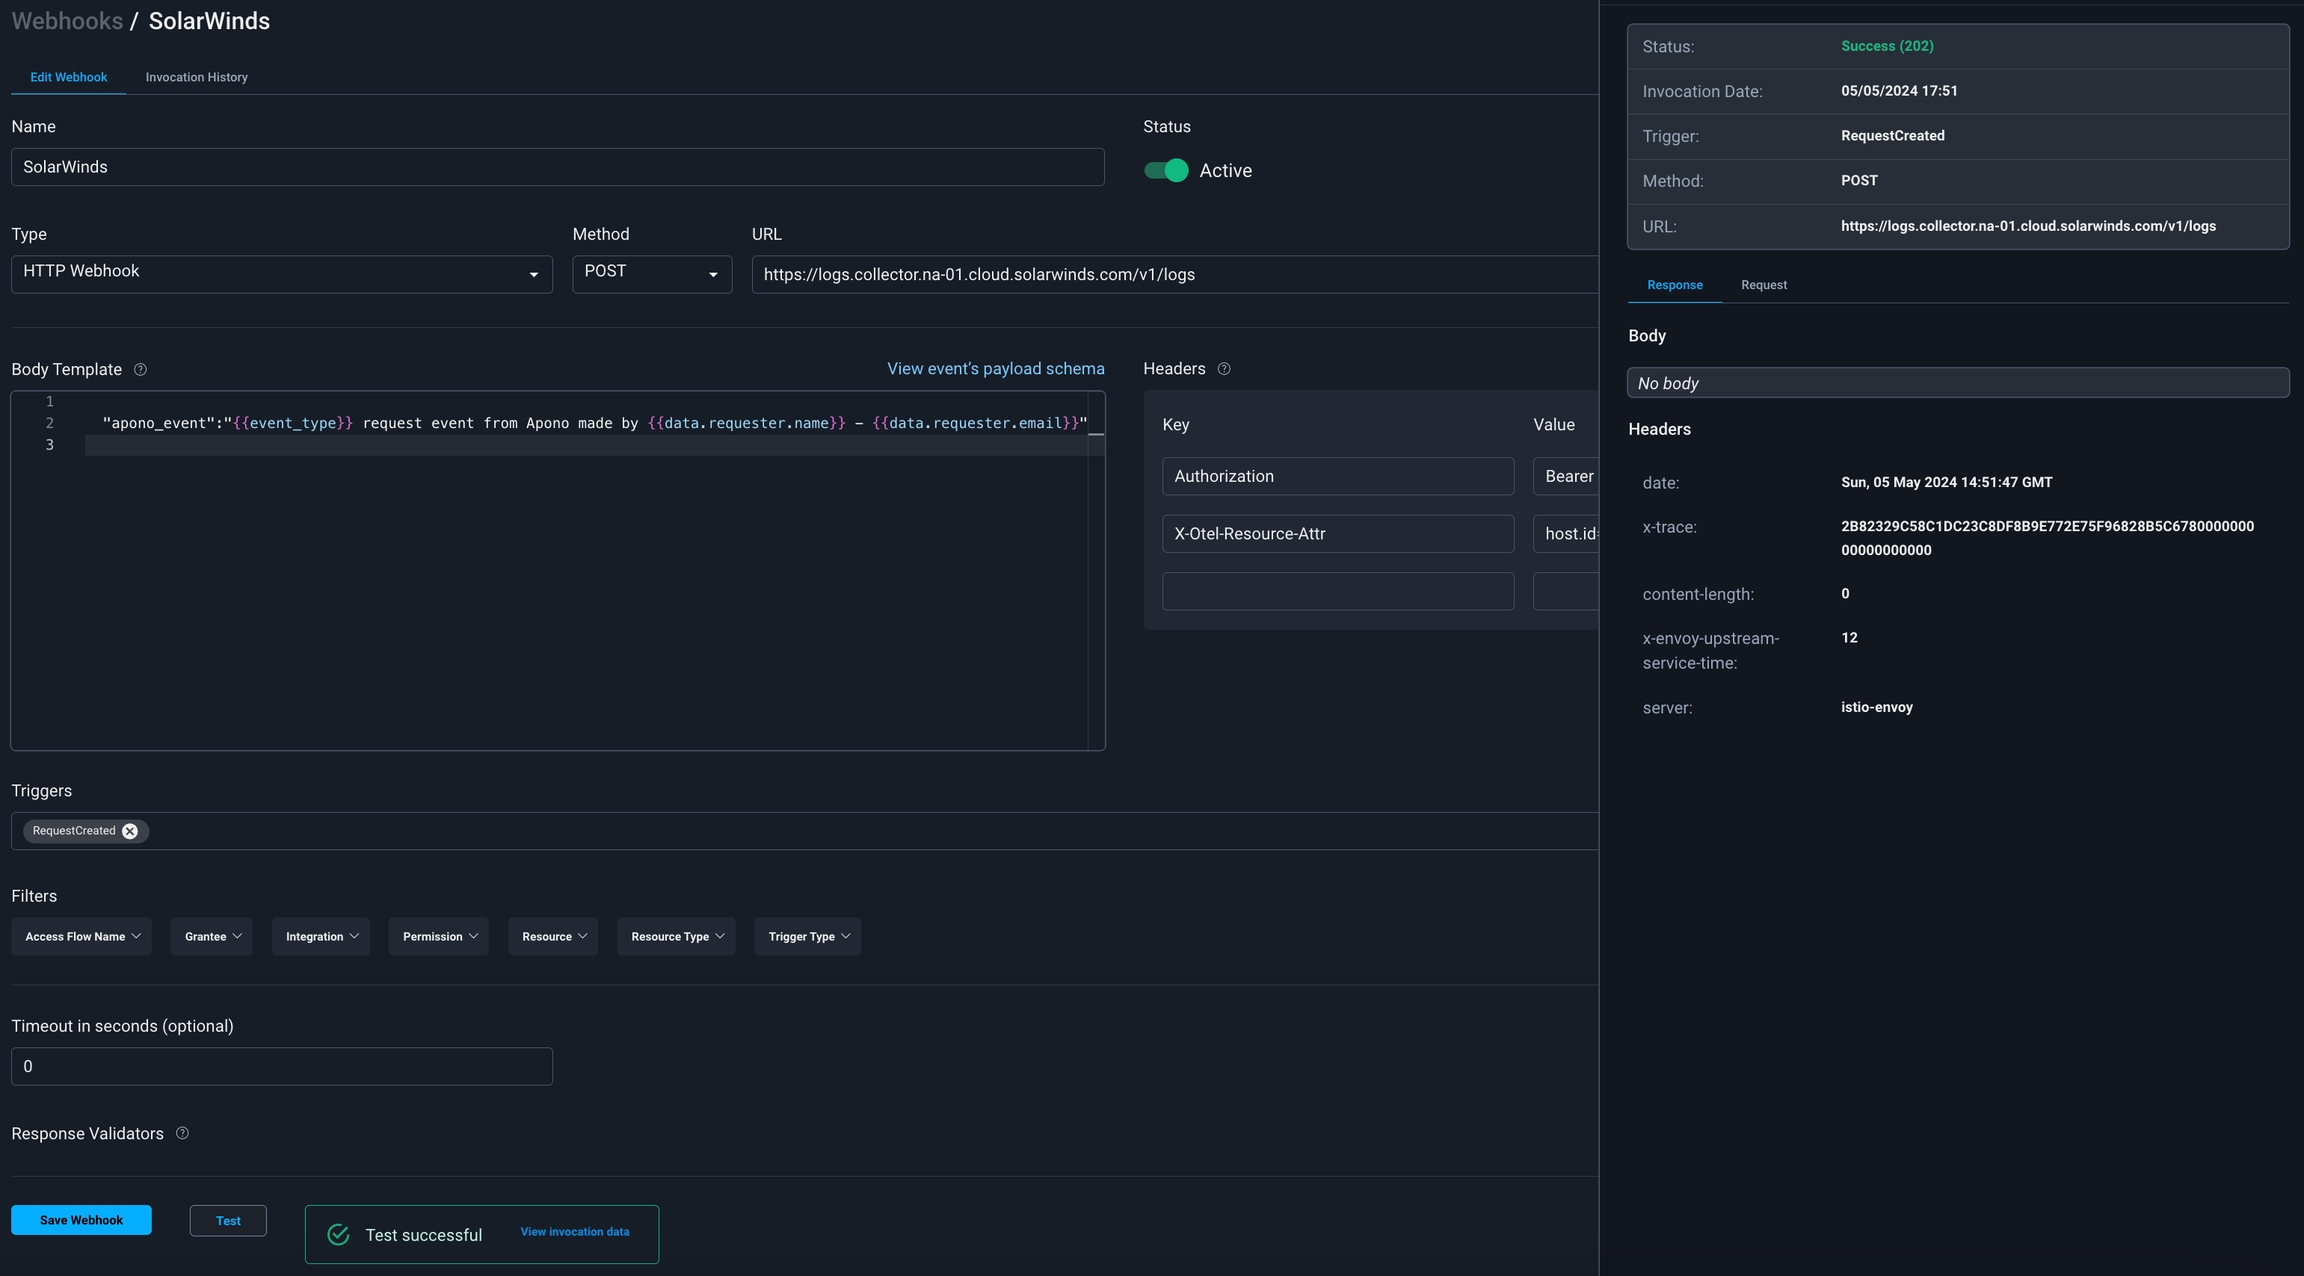
In the Body Template field, construct a JSON body for the webhook payload.
Click View event's payload schema to reveal the payload schema and available data fields. You can also refer to the Webhook Payload Schema Reference to read the descriptions of each data field.
Under Headers, use the following Key and Value to set the headers. Be sure to replace the <TOKEN> and <X-OTEL-RESOURCE-ATTR> placeholders.
Authorization
Bearer <TOKEN>
X-Otel-Resource-Attr
<X-OTEL-RESOURCE-ATTR> This is part of the subdomain of the SolarWinds account preceding cloud.solarwinds.com.
From the Triggers dropdown menu, select one or more of the following event triggers, which correspond to Apono access request statuses:
RequestCreated
RequestApproved
RequestExpired
RequestFailed
RequestGranted
RequestRejected
Under Filters, define one or several filter from the listed dropdown menus.
Filters empower admins to control the data transmitted via webhooks, minimizing the amount of data third-party tools receive and reducing unnecessary clutter.
Examples:
Send only production requests to your admins' Slack channel.
Trigger Okta workflows for events from specific integrations or resource types.
Open a ticket in Jira or ServiceNow for manually approved requests.
(Optional) In the Timeout in seconds field, enter the duration in seconds to wait before marking the request as failed.
(Optional) Define Response Validators to verify that the response from the webhook meets specified criteria:
Click + Add. A row of settings appears.
Starting with $.data., enter the Json Path of the JSON parameter.
In the Expected Values field, enter a value and press the Enter key on your keyboard.
Repeat step c to add several expected values.
Repeat steps a-d to add multiple response validators.
Click Test to generate a test event to trigger your webhook. A Test successful or Test failed response status will appear at the bottom of the page. A successful test will send mock data to the target system.
For more information about the test, click View Invocation Data. A panel opens revealing the request, response, and other relevant details.
Should your test fail, view these tips to troubleshoot your webhook.
Click Save Webhook.
The new webhook appears in the Webhooks table. Active webhooks are preceded by a green dot. Inactive webhooks are preceded by a white dot.
Apono access request logs will be sent to SolarWinds based on the triggers you have selected.
Your webhook should now start sending logs in the webhook SolarWinds account once triggered:
Permissions
Admin user for Logz.io account
Logz.io log shipping token
Used in shipper configurations to direct data to the relevant Logz.io account. Get your Logz.io log shipping token in the ADMIN ZONE section of the side navigation menu Settings > Manage tokens > Data shipping tokens tab
Logz.io Listener URL
The Listener URL for your account is displayed above the token table.
Permissions
Admin user for New Relic Admin account
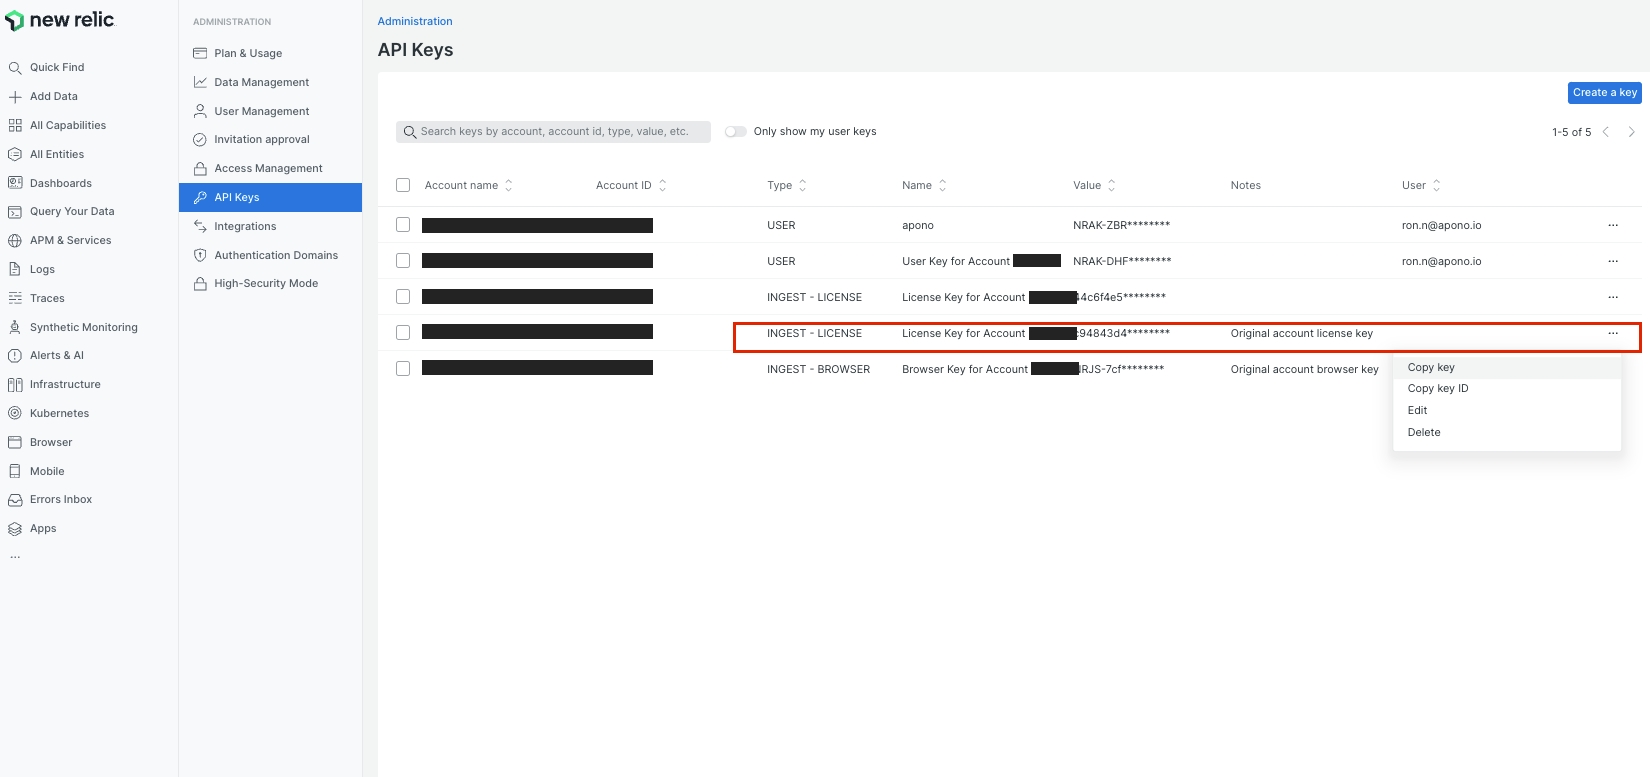
New Relic license token
From New Relic Admin portal click on your user logo on the left navigator bottom and choose API Keys. find your License Key for Account <YOUR_ACCOUNT_ID>, from the ... click on Copy key.
Permissions
Admin user for Grafana account
Enable Incoming Webhooks
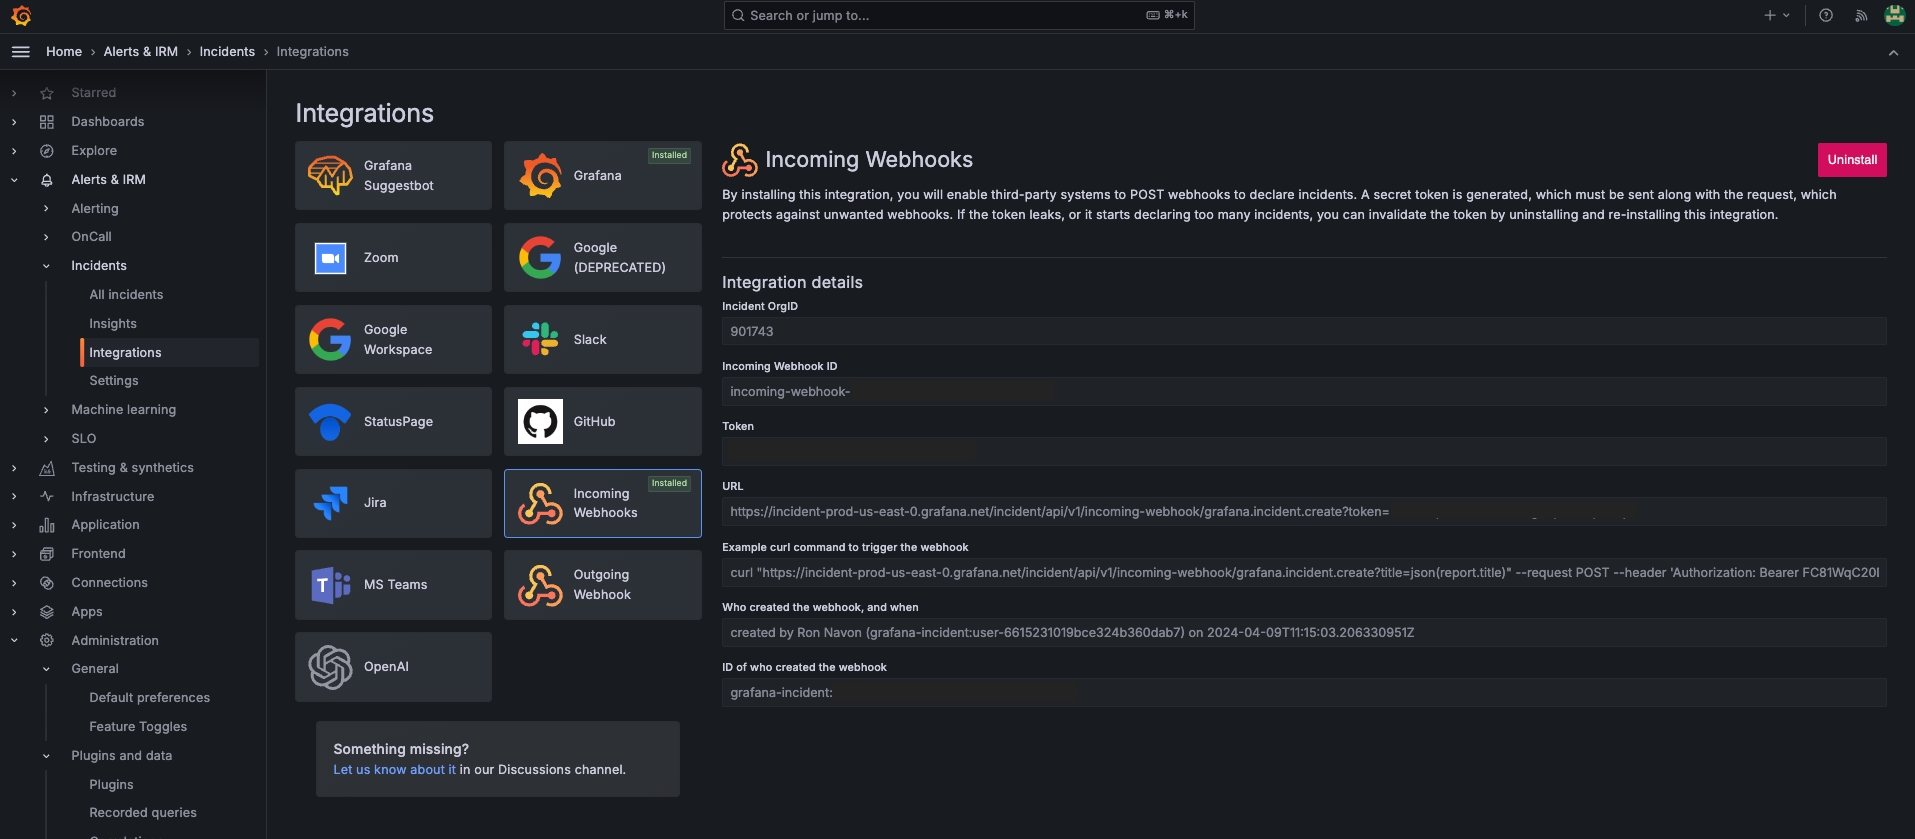
In the Grafana Incident web app, an admin can go to Integrations to enable incoming webhooks. Installing the Incoming Webhooks integration will generate a token which you will use to authorize the requests.
Go to Alerts & Incidents and under Incident choose Integrations.
Select the Incoming Webhooks integration.
Click Install integration.
Make note of the Token and URL fields as shown below.
Create Generic Incoming Webhook for the Apono app
Use the instructions in this link to create a Coralogix incoming webhook, to generate a webhook URL to connect Apono to Coralogix.
Create an outgoing webhook to send logs to Sumo Logic triggered by Apono access request events
Sumo Logic is a cloud-native secure, centralized log analytics service that provides insights into logs through pre-built applications, identifying patterns to show outliers in the behaviors of applications and systems.
This guide shows you how to configure and test outbound webhooks for Sumo Logic.
Sumo Logic Access key and copy the access key to use it later
Configure an HTTP Logs and Metrics Source (collection) for Apono app and copy the HTTP Source Address you get after saving the new collection
Set Message Processing to One Message Per Request:
Copy Apono app collection JSON configuration
Follow these steps to configure a webhook:
On the Webhooks page, click Add Webhook. The Add Webhook page appears.
Click Request Webhook.
Enter a unique, alphanumeric, user-friendly Request Webhook Name for identifying this webhook.
Click the Status toggle to Active.
From the Method dropdown menu, select POST.
For the webhook URL, enter the HTTP Source Address.
In the Body Template field, paste the collection JSON configuration for the webhook payload.
Click View event's payload schema to reveal the payload schema and available data fields. You can also refer to the Webhook Payload Schema Reference to read the descriptions of each data field.
For Headers, use the following Key and Value to set the authorization.
Authorization
From the Triggers dropdown menu, select one or more of the following event triggers, which correspond to Apono access request statuses:
RequestCreated
RequestApproved
RequestExpired
RequestFailed
RequestGranted
RequestRejected
Under Filters, define one or several filter from the listed dropdown menus.
Filters empower admins to control the data transmitted via webhooks, minimizing the amount of data third-party tools receive and reducing unnecessary clutter.
Examples:
Send only production requests to your admins' Slack channel.
Trigger Okta workflows for events from specific integrations or resource types.
Open a ticket in Jira or ServiceNow for manually approved requests.
(Optional) In the Timeout in seconds field, enter the duration in seconds to wait before marking the request as failed.
(Optional) Define Response Validators to verify that the response from the webhook meets specified criteria:
Click + Add. A row of settings appears.
Starting with $.data., enter the Json Path of the JSON parameter.
In the Expected Values field, enter a value and press the Enter key on your keyboard.
Repeat step c to add several expected values.
Repeat steps a-d to add multiple response validators.
Click Test to generate a test event to trigger your webhook. A Test successful or Test failed response status will appear at the bottom of the page. A successful test will send mock data to the target system.
For more information about the test, click View Invocation Data. A panel opens revealing the request, response, and other relevant details.
Should your test fail, view these tips to troubleshoot your webhook.
Click Save Webhook.
The new webhook appears in the Webhooks table. Active webhooks are preceded by a green dot. Inactive webhooks are preceded by a white dot.
Apono access request logs will be sent to Sumo Logic based on the triggers you have selected.
Your webhook should now start sending new logs to Sumo Logic once triggered:
Create an outgoing webhook in Apono that will send Apono access requests data to Torq Workflows
Torq is an AI-driven hyperautomation platform designed to help security teams automate processes quickly and efficiently. It offers features like pre-built integration steps, AI-generated workflows, and natural language chat for AI-augmented remediation of critical threats. Torq aims to enhance security operations by providing precision detection and machine-speed response.
This guide shows you how to configure and test outbound webhooks for Torq.
and copy the token to use it later.
to create endpoint for Apono access request events and trigger workflows.
Follow these steps to configure a webhook:
On the page, click Add Webhook. The Add Webhook page appears.
Click Request Webhook.
Enter a unique, alphanumeric, user-friendly Request Webhook Name for identifying this webhook.
Click the Status toggle to Active.
From the Method dropdown menu, select POST.
For the webhook URL, enter https://hooks.torq.io/v1/webhooks/<webhook-id>/.
In the Body Template field, paste the following JSON body for the webhook payload.
For Headers, use the following Key and Value to set the authorization.
From the Triggers dropdown menu, select one or more of the following event triggers, which correspond to Apono access request statuses:
RequestCreated
RequestApproved
RequestExpired
RequestFailed
RequestGranted
RequestRejected
Under Filters, define one or several filter from the listed dropdown menus.
Filters empower admins to control the data transmitted via webhooks, minimizing the amount of data third-party tools receive and reducing unnecessary clutter.
Examples:
Send only production requests to your admins' Slack channel.
Trigger Okta workflows for events from specific integrations or resource types.
Open a ticket in Jira or ServiceNow for manually approved requests.
(Optional) In the Timeout in seconds field, enter the duration in seconds to wait before marking the request as failed.
(Optional) Define Response Validators to verify that the response from the webhook meets specified criteria:
Click + Add. A row of settings appears.
Starting with $.data., enter the Json Path of the JSON parameter.
In the Expected Values field, enter a value and press the Enter key on your keyboard.
Repeat step c to add several expected values.
Repeat steps a-d to add multiple response validators.
Click Test to generate a test event to trigger your webhook. A Test successful or Test failed response status will appear at the bottom of the page. A successful test will send mock data to the target system.
For more information about the test, click View Invocation Data. A panel opens revealing the request, response, and other relevant details.
Click Save Webhook.
The new webhook appears in the Webhooks table. Active webhooks are preceded by a green dot. Inactive webhooks are preceded by a white dot.
Apono access request logs will be sent to Torq Workflows based on the triggers you have selected.
Create an outgoing webhook in Apono that will send Apono access requests data to Okta Workflows
The steps below describe how to create an outgoing webhook in Apono that will send data on Apono access requests to Okta Workflows. Then, configure any workflow you'd like in .
Follow these steps to configure a webhook:
On the page, click Add Webhook. The Add Webhook page appears.
Click Request Webhook.
Enter a unique, alphanumeric, user-friendly Request Webhook Name for identifying this webhook.
Click the Status toggle to Active.
From the Method dropdown menu, select POST.
In the URL field, enter https://<DOMAIN>.workflows.okta.com/api/flo/<CLIENT_TOKEN>.
Be sure to replace <DOMAIN> with your company domain and <CLIENT_TOKEN> with the clientToken generated in Okta Workflows.
The webhook URL must adhere to the following requirements:
Uses the HTTPS protocol
Does not specify any custom ports
In the Body Template field, construct a JSON body for the webhook payload.
(Optional) Under Headers, use the following Key and Value value to set the header. You can set the clientToken as a header value instead of passing it in the URL in step 6.
Be sure to replace the <CLIENT_TOKEN> placeholder.
From the Triggers dropdown menu, select one or more of the following event triggers, which correspond to Apono access request statuses:
RequestCreated
RequestApproved
RequestExpired
RequestFailed
RequestGranted
RequestRejected
Under Filters, define one or several filter from the listed dropdown menus.
Filters empower admins to control the data transmitted via webhooks, minimizing the amount of data third-party tools receive and reducing unnecessary clutter.
Examples:
Send only production requests to your admins' Slack channel.
Trigger Okta workflows for events from specific integrations or resource types.
Open a ticket in Jira or ServiceNow for manually approved requests.
(Optional) In the Timeout in seconds field, enter the duration in seconds to wait before marking the request as failed.
(Optional) Define Response Validators to verify that the response from the webhook meets specified criteria:
Click + Add. A row of settings appears.
Starting with $.data., enter the Json Path of the JSON parameter.
In the Expected Values field, enter a value and press the Enter key on your keyboard.
Repeat step c to add several expected values.
Repeat steps a-d to add multiple response validators.
Click Test to generate a test event to trigger your webhook. A Test successful or Test failed response status will appear at the bottom of the page. A successful test will send mock data to the target system.
For more information about the test, click View Invocation Data. A panel opens revealing the request, response, and other relevant details.
Click Save Webhook.
The new webhook appears in the Webhooks table. Active webhooks are preceded by a green dot. Inactive webhooks are preceded by a white dot.
Apono access request logs will be sent to Okta Workflows based on the triggers you have selected.
Your webhook should now start sending events payloads to the workflow once triggered.
Custom details:
Alert details:
Basic <>
Click View event's payload schema to reveal the payload schema and available data fields. You can also refer to the to read the descriptions of each data field.
Should your test fail, view these tips to .
Click View event's payload schema to reveal the payload schema and available data fields. You can also refer to the to read the descriptions of each data field.
Should your test fail, view these tips to .
Authorization
Bearer <BASE64-TORK-TOKEN>
x-api-client-token
<CLIENT_TOKEN>
Permissions
Super admin with access to Okta Workflows
Configure your API endpoint settings
Follow these steps to configure API endpoint settings:
Create a flow in your Workflows Console and click Add event.
From the Pick an app to start your flow dialog, select API Endpoint.
In the API endpoint settings dialog, select Secure with OAuth 2.0 as the security level.
