
Grafana
Create an outgoing webhook to create incidents to Grafana triggered by Apono access request events
Grafana allows you to query, visualize, alert on, and understand your metrics no matter where they are stored. Create, explore, and share dashboards with your team and foster a data-driven culture.
Prerequisite
Permissions
Admin user for Grafana account
Enable Incoming Webhooks
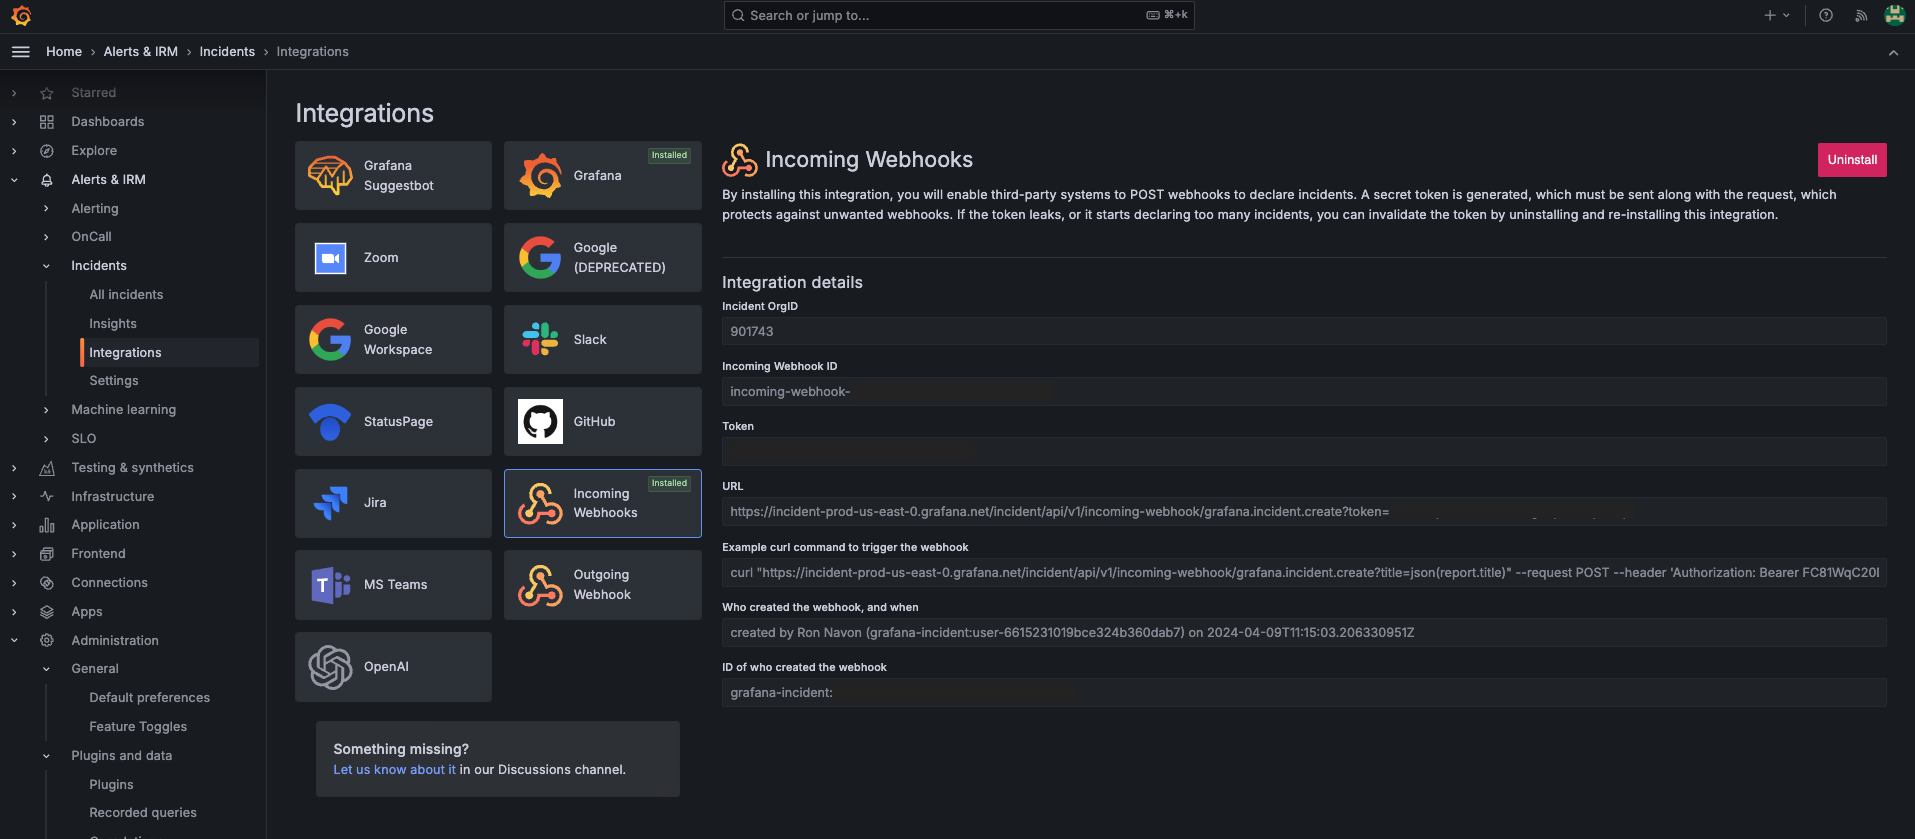
In the Grafana Incident web app, an admin can go to Integrations to enable incoming webhooks. Installing the Incoming Webhooks integration will generate a token which you will use to authorize the requests.
Go to Alerts & Incidents and under Incident choose Integrations.
Select the Incoming Webhooks integration.
Click Install integration.
Make note of the Token and URL fields as shown below.
Creating the webhook
Follow these steps to configure an Apono webhook:
On the Webhooks page, click Add Webhook. The Add Webhook page appears.
Click Request Webhook.
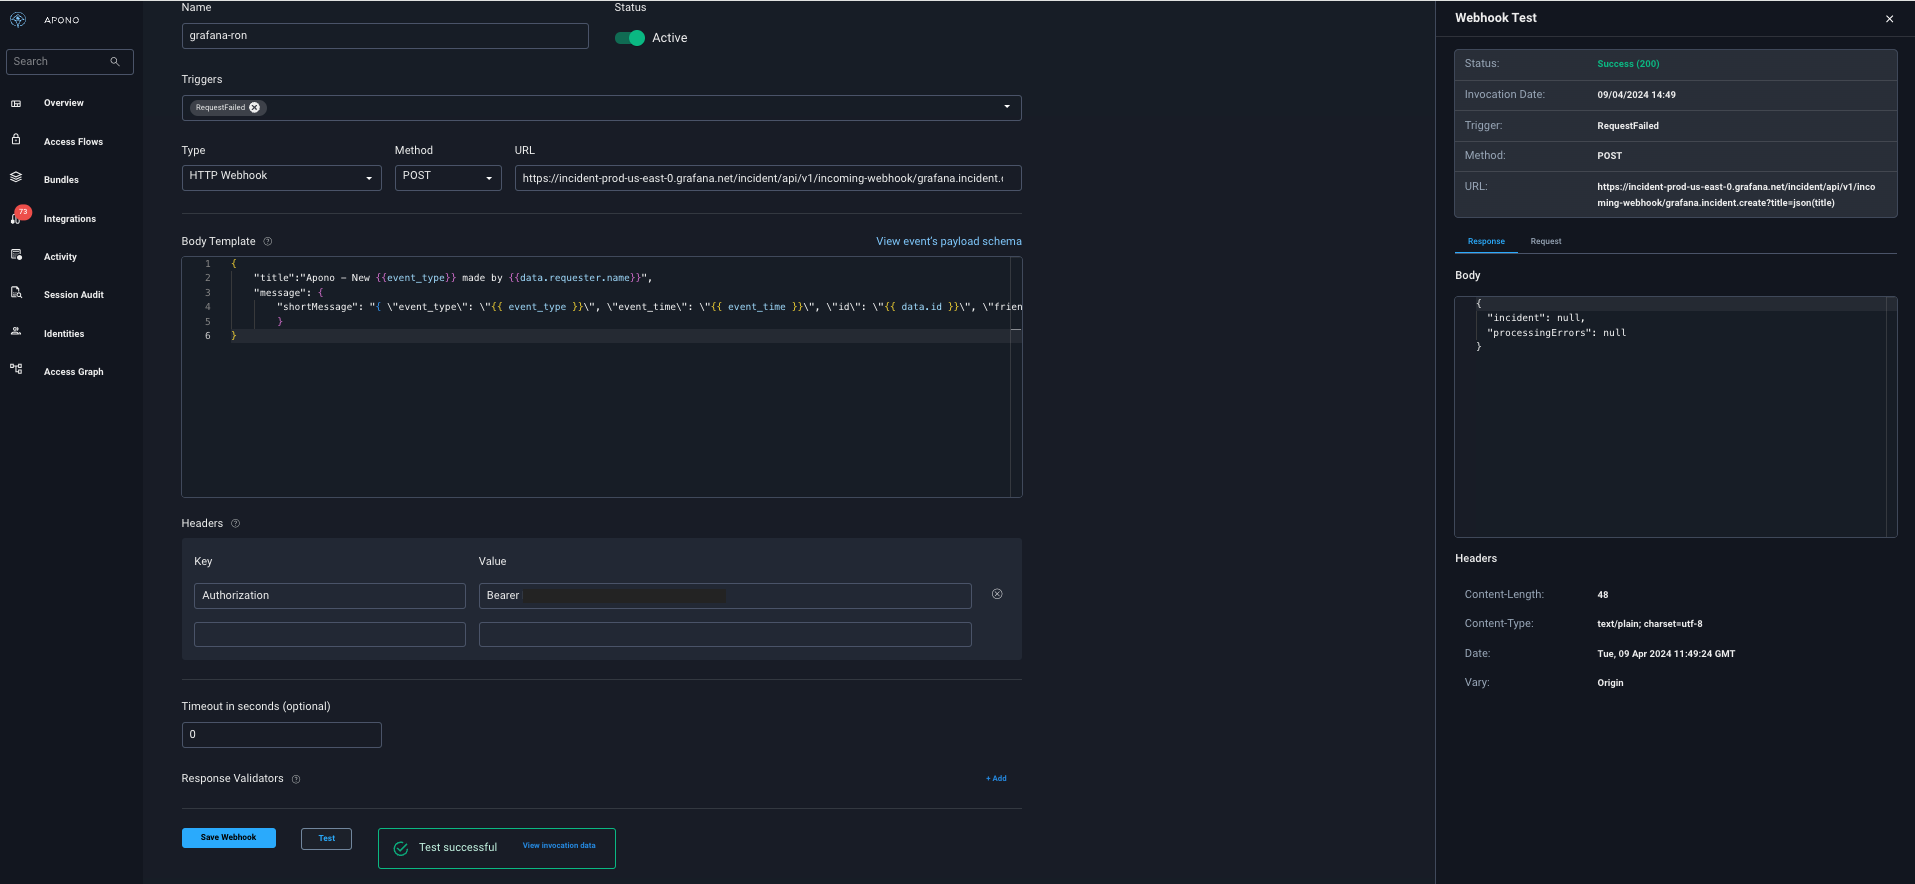
Enter a unique, alphanumeric, user-friendly Request Webhook Name for identifying this webhook.
Click the Status toggle to Active.
From the Method dropdown menu, select POST.
In the URL field, enter https://<INCOMING_WEBHOOK_URL>?title=json(title). Be sure to replace the
<INCOMING_WEBHOOK_URL>placeholder.
The webhook URL must adhere to the following requirements:
Uses the HTTPS protocol
Does not specify any custom ports
In the Body Template field, construct a JSON body for the webhook payload.
Click View event's payload schema to reveal the payload schema and available data fields. You can also refer to the Webhook Payload Schema Reference to read the descriptions of each data field.
Under Headers, use the following Key and Value to set the header. Be sure to replace the
<INCOMING_WEBHOOK_TOKEN>placeholder.
Authorization
Bearer <INCOMING_WEBHOOK_TOKEN>
From the Triggers dropdown menu, select one or more of the following event triggers, which correspond to Apono access request statuses:
RequestCreated
RequestApproved
RequestExpired
RequestFailed
RequestGranted
RequestRejected
Under Filters, define one or several filter from the listed dropdown menus.
Filters empower admins to control the data transmitted via webhooks, minimizing the amount of data third-party tools receive and reducing unnecessary clutter.
Examples:
Send only production requests to your admins' Slack channel.
Trigger Okta workflows for events from specific integrations or resource types.
Open a ticket in Jira or ServiceNow for manually approved requests.
(Optional) In the Timeout in seconds field, enter the duration in seconds to wait before marking the request as failed.
(Optional) Define Response Validators to verify that the response from the webhook meets specified criteria:
Click + Add. A row of settings appears.
Starting with $.data., enter the Json Path of the JSON parameter.
In the Expected Values field, enter a value and press the Enter key on your keyboard.
Repeat step c to add several expected values.
Repeat steps a-d to add multiple response validators.
Click Test to generate a test event to trigger your webhook. A Test successful or Test failed response status will appear at the bottom of the page. A successful test will send mock data to the target system.
For more information about the test, click View Invocation Data. A panel opens revealing the request, response, and other relevant details.
Should your test fail, view these tips to troubleshoot your webhook.
Click Save Webhook.
The new webhook appears in the Webhooks table. Active webhooks are preceded by a green dot. Inactive webhooks are preceded by a white dot.
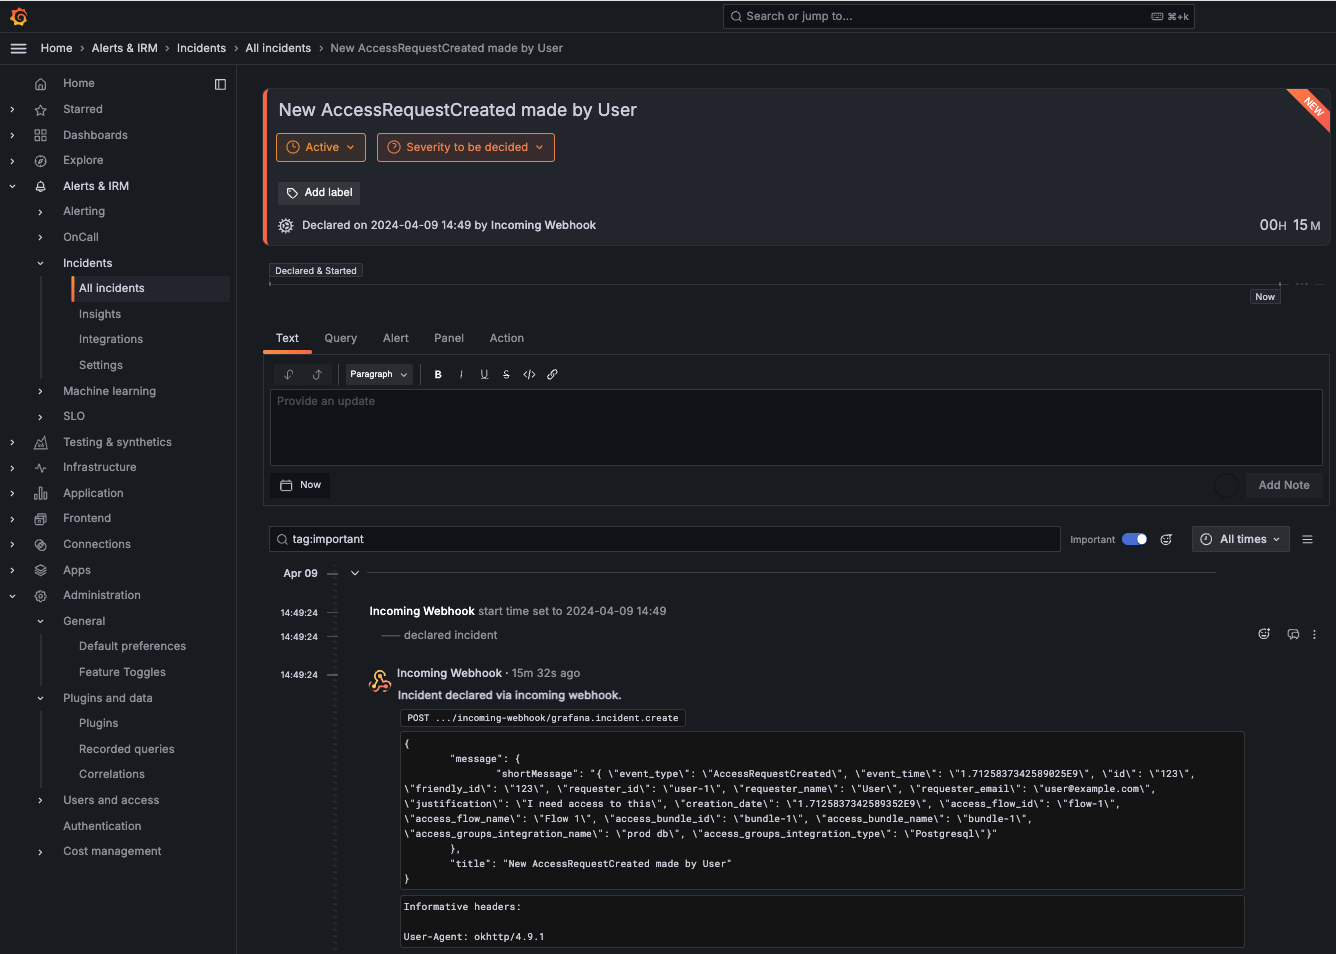
Apono access request logs will be sent to Grafana based on the triggers you have selected.
Results
Your webhook should now start creating new incidents to Grafana once triggered:
Last updated
Was this helpful?